Explore BrainMass

Explore BrainMass

    Statistical Theory

    Statistical theory is a very general concept which serves to elucidate the origin of other statistical practices. For example, the practices of statistical inference, mathematical statistics, probability and statistical decision-making, are all based from the framework of statistical theory.

    Furthermore, the study designs and data analyses practiced by researchers and statisticians are techniques which satisfy the principles of statistical theory. Similarly, comparisons can be generated between data sets because statistical theory provides the necessary guide required for comparing data. Evidently, statistical theory is a part of all areas of statistics which involve analyzing, describing, and using data to create conclusions and formulate future decisions. 

    Statistical theory provides the rationale for the full range of steps involved in statistical analyses. The techniques of modelling, data collection, summarising data and interpreting data are all based from statistical theory. For example, in terms of summarising data, the principles of statistical theory account for the different ways which data can be summarised and which aspects of the data should be summarized. Additionally, statistical theory addresses how well a limited sample size can describe a data set.

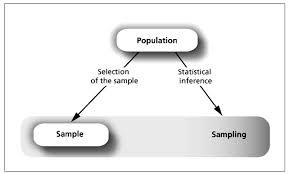
    Clearly, in the study of statistics, statistical theory has many applications and therefore, allows statistics to extend beyond pure mathematics and connect research with the real world. It is through statistical theory that predictions and/or conclusions can be made from data sets, which is the general objective of statistical inference. Furthermore, it allows researchers to attempt to answer problems and explain cause-and-effect phenomena. Thus, it is also linked to the subjects of Bayesian inference and general estimation. 

    © BrainMass Inc. brainmass.com March 18, 2024, 6:27 pm ad1c9bdddf

    BrainMass Categories within Statistical Theory

    BrainMass Solutions Available for Instant Download

    Nicotine confidence interval estimates

    Refer to Data Set 4 in Appendix B and assume that the samples are simple random samples obtained from normally distributed populations. a. Construct a 95% confidence interval estimate of the mean amount of nicotine in cigarettes that are king size, nonfiltered, nonmenthol, and non-light. b. Construct a 95% confidence interva

    correlational and regression studies definitions

    Discuss the strengths and weaknesses of correlational and regression studies; discuss concepts such as positive and negative correlations, correlation coefficients, confounding, and causality.

    Spearman rank correlation coefficient by Messina

    1) Write a paper (750-1,000 words) regarding the use of the Spearman rank correlation coefficient by Messina, et al. in "The Relationship between Patient Satisfaction and Inpatient Admissions Across Teaching and Nonteaching Hospitals," listed in the module readings. 2) Comment on what variables were used; whether it answered th

    Regression Models

    [1] The data in DJIA.xls represent the closing values of the Dow Jones Industrial Average (DJIA) from 1979 through 2008. a) Plot the time series. b) Find a three-years moving average to the data and plot the results. c) Using a smoothing coefficient of W= 0.30, exponentially smooth the series and plot the results. [2] R

    T-Test - Applied Statistics for Psychology

    MM570 Applied Statistics for Psychology Unit 6 Project: Descriptive Statistics Review Sheet Place all answers, work, and graphs in this document. Use alpha = .05 for all hypothesis testing questions. ** Please use non-directional two-tailed tests for these questions (not one-tailed tests). **All SPSS output must be sh

    EconomicSTATS and Forecast Function

    See the attached files. 1. Using regression analysis, (i.e. do not use the forecast function in Excel) forecast the average annual consumption of natural gas for each group in 2014. That is, how much natural gas is consumed during an average month? How confident would you be in concluding the coefficient estimates are not

    Financial Advisement: Regaining Stocks

    Assume the financing gurus of a weekend investment television program predicted a 50% chance of XYZ stock gaining in January and a 50% chance of gaining in February. Your financial advisor sees this and tells you there is a 100% chance XYZ stock will gain over the 2-month period. Would you continue to use this financial advisor?

    Air Force Training Program

    This is an analytic review that needs to be done using the data computed in minitab. The guidlines for the review and the problem have been uploaded as well 1) Use Minitab software to generate the output used in your analysis. The file containing the problem data, <AIRFORCE.MTW 2) You are expected to folow the report form

    Decision theory: optimal solution and conditional probability

    Stochastic Operations Research Read: Sections 12.3 - 12.5, 13.1, 13.4-13.6 in "Winston, Operations Research: Application and Algorithms, 4th edition, 2004, Thompson, ISBN 0-534-38058-1." Question 1 Diamond and Forrester (1979) applied Bayes' rule to the diagnosis of coronary artery disease. A procedure called cardiac fl

    Sampling Distribution and Population Distribution

    I assume my scenario will have to include enough information to answer the questions below so I will need help with this one as well Create and write your own scenario about a specific population. Then, answer the following questions about your scenario: What are the mean, standard deviation, and shape of the population d

    Probability distributions - normal distribution

    1. What percentage of the area under the normal curve lies a. To the left of the mean? b. Between μ - 2σ and μ + 2σ? c. More than three standard deviations above the mean? 2. Over an entire summer, an amusement park gets an average of 21.7 people per day that have to go to the infirmary. Some days it is higher than

    Computing Cumulative Function, Mean, and Variance

    5. A continuous random variable has a probability density function: f(x) = Ax^2 for 0 (less than or equal to) x (less than or equal to) 3. (a) What is the value of A? (b) What is the cumulative probability function of random variable x? (c) What is the expected value? (d) What is the variance of the random variable?

    Z scores for a math and spanish exam

    A student had exams in math and Spanish. On the math the mean was u=30 and o= 5 and the student had a score of x=45. On the Spanish exam the mean was u= 60 and o=8 and the student has a score of x=68 . For which class can the student expect the better grade? What is the z score corresponding to the mean? What is the N val

    Z-Scores and Extreme Scores

    Please explain how I set up and solve this problem: For each of the populations would a score of x= 50 be considered a central score (near the middle of the distribution) or an extreme score (far out of the tail of the distribution ) is this set up x-u/o? u=45 o= 10 u=45 o= 2 u= 90 o= 20 u= 60 o=20 If i have a proble

    Determining the Sum of Squares, Variance, Standard Deviation

    Please help me calculate the ss, variance and standard deviation for this. n=4 scores are 7, 4, 2, 1 (do i figure the mean here 1st? 3.5?) ss____ variance____ standard deviation____ Also if a population has a mean of 80 and standard deviation of 20 would the score of x=70 be considered extreme in the sample? If the s

    Statistics: Moment Generating Function

    It is attached it is to show that if all Xi are normally distributed then Y=a1X1+a2X2+...+anXn Also is normally distributed But please see the attachment as the question is a bit more specific than that as well. Thanks File is uploaded in pdf and word

    spss

    12. A college using a new method of teaching calculus wishes to evaluate the effectiveness of the method. A class of 24 first-year college students was randomly divided into two sections, one of which was taught using the new method and the other taught using the old method. Scores on the end-of-semester exam for the two groups

    Normally Distribututed Data

    Please help with this multi-part question on statistics: The YUMM cereal company distributes Colored Sugar Cereal. Each box is supposed to contain 450 grams of cereal. They also sell cereal in a "2-pack," where each "2-pack" contains 2 boxes of cereal. The 2-packs are supposed to have a total weight of 900 grams. YUMM can choo

    Finding Mean and Standard Deviation for PDF Function

    Refere to attachment for better formula representation. Let (Y1, Y2,...Yn) be a random sample from a uniform probability density functions (p.d.f) given by: f (y;theta) = (1-theta)^-1, theta<y<1 a. Find the mean of Y and shown that the variance of Y is (1-theta)^2/12 b. Show that theta = 2(sum Y/n) -1 is an unbiased estimat

    Maximum Likelihood Estimator

    Let x1, x2,.....xn be a random sample from a Poisson distribution with parameter lamda, that is the p.d.f is see attached What is the maximum likelihood estimator of lamda? Is it fully efficient in small samples?

    need assistance to figure this out

    You have taken data from a production process in order to develop an Xbar control chart. You have 25 samples of data with 5 parts measured in each sample to get the Xbar and R (Range). Use this data shown in the table. Sample 1 2 3 4 5 Xbar R 1 1.55 1.58 1.64 1.67 1.50 1.588 0.17 2 1.52 1.62 1.71 1.74 1.60 3 1.47 1.5

    Wind Turbine Power Calculations

    (Please see the attached file for the complete problem description). Please help with the following calculations. Provide the answers in Excel. Please show all of your work so that I can understand and continue with my assignment. Thank you.

    Two Sample T-Test for Equal Means of Two Groups

    In a randomly controlled trial conducted with children suffering from croup, 46 randomly selected children were treated with ow humidity while another group of randomly selected children were treated with high humidity. Using a Wesley Croup test score, the low humidity group had a mean score of 0.98 with a standard deviation of

    Test for Proportions

    Conduct a test of hypothesis for the claim that a greater proportion of women agree wth this statement than men. Use a 0.05 level of significance. a) Correctly state the hypotheses and label the claim b) Draw a diagram correctly showing the sampling distribution c) Calculate the test statistic d) Give the p value e) Tell if

    confidence interval for the proportion difference

    A Pew research study recently randomly selected two groups of people, men and women and asked them if they agree with the following statement: "It s morally wrong for a married person to have an affair" Among 386 women, and 347 agreed with the statement. Among 359 men surveyed, 305 agreed with the statement. Construct a 95% c

    Random Sampling - statistics

    Doctors identify "chronic tension-type headaches" as headaches that occur almost daily for at least six months. Can antidepressant medications or stress management training reduce the number and severity of these headaches? Are both together more effective than either one alone? The research design necessitates the creation of 4

    Calculating the Confidence Interval for Standard Deviation

    In manufacturing tablets, the quantity of active ingredient that is required to lie within 5 mg of the mean is normally distributed and the required condition is considered to hold if sigma < 1.6. A sample of 35 tablets has a sample standard deviation s = 1.321 (a) Find a 95% confidence interval for sigma. (b) Formulate and pe

    Calculate Z scores for the depenent and independent variable

    Calculate Z scores for the dependent and independent variable values in the two hypotheses below. This will require calculating the standard deviation and converting the scores to Z scores. Hypothesis: 1 (population per 100,000 ROBBERY ARRESTS CONVICT

    Six Sigma Project

    Please use information provide on step 1 and 2 to resolve steps 3, 4, 5. 3) Define Phase Based on the problems identified on step two I need a Project Scope Statement and a SIPOC. 4) Repeatability and Reproducibility System Report showing what data must you collect? Who will collect the data? How do you trust that the d