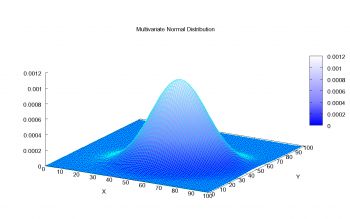
Multivariate statistics is a form of statistics encompassing the simultaneous observation and analysis of more than one outcome variable. The application of multivariate statistics is multivariate analysis. Multivariate statistics is concerned with understanding the different aims and background of each of the different forms of multivariate analysis and how they relate to each other. It is also concerned with multivariate probability distribution in terms of how these can be used to represent the distribution of observed data and how they can be used as part of statistical inference, where several different quantities are of interest to the same analysis.
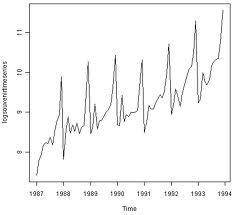
A time series is a sequence of data points measured at successive points in time spaced at uniform time intervals. Time series are used in statistics, signal processing, pattern recognition, econometrics, mathematical finance and many more. Time series analysis comprises methods for analyzing time series data in order to extract meaningful statistic and other characteristics of the data. Time series forecasting is the use of a model to predict future values based on previously observed values.
Survival analysis a branch of statistics that deals with the analysis of time to events; for example, the death in biological organisms and failure in mechanical systems. This topic is called reliability theory. Survival analysis also attempts to answer the questions of that is the proportion of a population which will survive past a certain time, or can multiple causes of death or failure be taken into account. Survival analysis involves the modeling of time to event data. Reoccurring events or repeated event models relax assumptions that only a single event occurs for each subject.
© BrainMass Inc. brainmass.com July 22, 2026, 8:56 am ad1c9bdddf