Explore BrainMass

Explore BrainMass

    Correlation and Regression Analysis

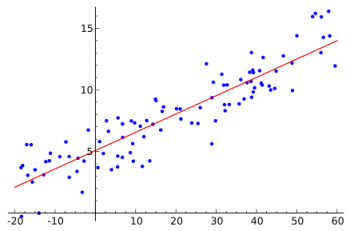
    Regression analysis involves identifying the relationship between a dependent variable and one or more independent variables. A model of the relationship is hypothesized, and estimates of the parameter values are used to develop an estimated regression equation. Various tests are then employed to determine if the model is good. If it is, the estimated regression equation can be used to predict the value of the dependent variable given values for the independent variables.

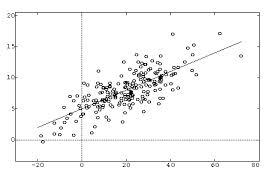
    Dependence refers to any statistical relationship between two random variables or two sets of data. Correlation refers to any broad class of statistical relationships involving dependence. Correlations are useful because they can indicate the predictive relationship that can be exploited in practice. Statistical dependence is not sufficient to demonstrate the presence of such a causal relationship.

    Correlation and regression analysis are related in the sense that both deal with relationships among variables. The correlation coefficient is a measure of linear association between two variables. The correlation coefficient is a measure of linear association between two variables. Values of the correlation coefficient are always between -1 and +1. Neither regression nor correlation analysis can be interpreted as establishing case-and-effect relationships. They can indicate only how or to what extend variables are associated with each other. 

    © BrainMass Inc. brainmass.com March 15, 2024, 1:14 am ad1c9bdddf

    BrainMass Categories within Correlation and Regression Analysis

    Binomial

    Solutions: 38

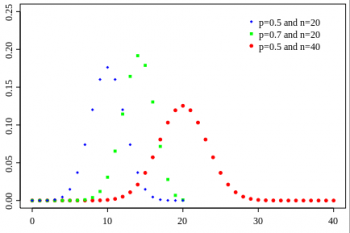
    Binomial distribution is the discrete probability distribution of the number of successes in a sequence of n independent yes/no experiments, each which yields success with probability p.

    Poisson

    Solutions: 11

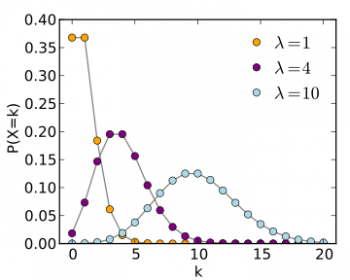
    The Poisson distribution is a discrete probability distribution that expresses the probability of a given number of events occurring in a fixed interval of time and/or space if these events occur with a known average rate and independently of the time since the last event.

    BrainMass Solutions Available for Instant Download

    Statistical Analysis of Telecom Data

    The data provided in CSV represents the sales and churn results of transactions between 2019 and 2022 of micro financing products bound with telecom service. It is needed statistics correlations study over the attached data. Shall underline areas for corrections and observation in specific segments.

    Forecast Analysis for Performance Lawn Equipment

    An important part of planning manufacturing capacity is having a good forecast of sales. Elizabeth Burke is interested in forecasting sales of mowers (units sales) and tractors ( unit sales) in each marketing region in the Excel (using exponential smoothing and linear plots) forecast should be a year out so you will be forecasti

    Probabilities using the Normal Distribution

    1. True or False? A normal distribution is a continuous probability distribution used with continuous random variables. 2. If a z-score is close to −3.49, the cumulative area is close to what value? 3. What is the area under a standard normal curve between z = −1.47 and z = 1.58? 4. What is the area under a standard

    Multiple Regression Example from Real Life

    Identify a research question from your professional life or research interests that could be addressed with multiple regression with two predictor variables. Describe the predictor variables ( X1, X2), the outcome variable ( Y), and the associated measurement scales. Articulate the expected outcome. Indicate why multiple regress

    Regression model dummy variables

    At times we need to include a dummy variable in the regression model. Provide an example of a multiple regression model that includes a dummy variable and that can be used to predict an outcome in your department or life. What assumptions do you need to make concerning the slope between the dependent variable and the numerical a

    Correlation and Bivariate Regression in Practice

    As a critical consumer of research critically evaluate a scholarly article related to correlation and bivariate regression. • Search for a quantitative article related to correlation and bivariate regression. Critique of the article you found. In your critique, include responses to the following: • Why did the autho

    Discussion: Correlation and Bivariate Regression

    This Solution works with a real, secondary dataset to construct a research question, perform a correlation and bivariate regression model, and interpret the results. Whether in a scholarly or practitioner setting, good research and data analysis should have the benefit of peer feedback. For this Discussion, you will post your

    Correlation, Regression and Normal Distribution Practice Questions

    a. The headline of a January 31, 2005 USA Today article read, "'January Barometer' predicts a pretty lousy year." Referring to the stock market (and in particular the S&P 500), the article goes on to say that the month of January was "turning out to be a loser and chances are 2005 will be, too." To support the claim, the arti

    Perform regression analysis using linear mode, logarithmic model

    The Flyair Company manufactures a sophisticated radar unit that is used in a fighter aircraft built by Seaways Aircraft. The first 85 units of the radar unit have been completed and Flyair is preparing to submit a proposal to Seaways Aircraft to manufacture the next 50 units. Flyair wants to submit a competitive bid, but at t

    Statistical Analysis - Multiple Regression Model

    Need assistance interpreting my statistics and ensuring they are correctly performed as well as I need a F Test completed. I've highlighted everything in yellow that I need assistance on. Stats are provided for most questions, just need assistance with interpreting and a F Test

    Inferential Statistical Analysis

    Question 1 A company wants to produce three different mobile phones, with low-range, mid-range and high-range specifications, respectively. A survey with 100 respondents has been used to reveal the choices of potential customers. The company wants to review the figures to see if the three mobile phones would be equally popular.

    Solve forecasting questions using naive, moving average

    Hello, I need the answer for these 3 questions please: I have also attached the same questions in a Word file... Q1. Sales (in thousands) of the new Thorton Model 506 convection oven over the eight-week period since its introduction have been as follows: Week Sales 1 18.6 2 21.4 3 25.2 4 22.4 5 24.6 6 19.2 7 21.7

    Population in the news

    Locate a news article or report (in a popular news source such as Time, Newsweek, or the Wall Street Journal) in which a population mean is estimated from a sample. The article should include a margin of error and confidence interval. Discuss the subject matter in the article, and interpret the results and what the confidence in

    Regression Analysis - Using PHStat or Excel

    [1] A research analyst for an oil company wants to develop a model to predict miles per gallon based on highway speed. An experiment is designed in which a test car is driven at speeds ranging from 10 miles per hour to 75 miles per hour. The results are in the data set (SPEED.xls). a) Set up a scatter diagram for speed and mi

    Multiple Regression Analysis: Locating New Pam and Susan's Stores

    Case Study Pam and Susan's is a chain of discount department stores.* The original store was opened in the South in the mid-1950s by Pam and Susan's father. About 10 years ago, Pam and Susan took over operational control of the stores, working together under a joint power sharing arrangement. The unusual management arrangement

    Multiple Regression Analysis

    [1] A consumer products company wants to measure the effectiveness of different types of advertising media in the promotion of its products. Specially, two types of advertising media are to be considered: radio and television advertising and newspaper advertising (including the cost of discount coupons). A sample of 22 cities

    Hypothesis Testing and Confidence Interval...

    Based on data from USA Today, tax returns include an option of designating $3 for presidential election campaigns, and it does not cots the taxpayer anything to make that designation. In a simple random sample of 250 taxpayer returns from 1976, 27.6% of the returns designated the $3 for the campaign. In a simple random of 300

    Hypothesis Testing - PHStat/Excel/SSBEC

    [1] A random sample of the birth weights of 186 babies has a mean of 3103g and a standard deviation of 696g (based on data from ``Cognitive Outcomes of Preschool Children with Prenatal Cocaine Exposure,'' by Singer et al., Journal of the American Medical Association, Vol. 291, No. 20. These babies were born to mothers who did n

    Obtaining regression equation & correlation using excel toolpak

    Name: Date: Topic Five: Correlation/Regression and Chi Square Excel Worksheet Directions: Answer all problems and submit to instructor at the end of Module 5 SYSTOLIC AND DIASTOLIC BLOOD PRESSURE OF FEMALES The following table represents systolic and diastolic blood pressure measurements of 40 females. A) Use the

    Multiple Regression Analysis..

    Multiple Regression Model A study was carried out to explore the relationship between Aggression and several potential predicting factors in 666 children who had an older sibling. Variables measured were Parenting Style (high score = bad parenting practices), Computer Games (high score = more time spent playing computer games),

    Calculations of Regression Analysis

    See the attached file. 1. If Janice Position-Classification, personnel officer for the Bureau of Forms, can forecast agency separations 6 months from now, she can plan recruitment efforts to replace these people. Janice believes that separations 6 months from now are determined by the number of agency people passed over for pro

    Chi-square Test & Correlation Coefficient

    1. Use the contingency table below to determine if there is evidence of a significant difference between proportions of males and females who enjoy shopping for clothing at the 0.01 level of significance. Determine the p-value in (a) and interpret its meaning. Yes No Total Males 136 104 240 Females 224 36 260 Total 360 1

    Building a Quadratic Regression Model

    See attachment for data on y = green liquor (g/L) and x = paper machine speed (ft/min) from a Kraft paper machine. (a) Fit the model Y = Bo + B1x + B2x^2 + e using least squares. (b) Test for significance of regression using alpha = 0.05. What are your conclusions? (c) Plot the residuals from the model in part (a) versus

    Regression and Time Series Analysis

    The data in the table below represent the annual revenues(in billion of dollars) of McDonald's Corporation over the 31-year period from 1975 t0 2005. Year Coded Yr Revenues 1975 0 1 1976 1 1.2 1977 2 1.4 1978 3 1.7 1979 4 1.9 1980 5 2.2 1981

    Scatter Plots and Correlation Coefficients

    Question 1: Problem 2.13 from the text. Use Excel to construct your scatter plot. Write your answers to the questions in a word document. Include the scatter plot you created in your word document. Question 2: Problem 2.37 from the text. Use Excel to construct a scatter plot. Compute the correlation coefficient by using colum

    Quadratic Regression and Model Buildling

    Quadratic Regression Problem The marketing department wants to study the effect of price on the sales of packages of disposable razors. A sample of 15 stores is selected. The number of packages sold over a full week and the price at each store are in the following table (see attached file for data). a. Construct

    Multiple Regression Analysis of Moving

    Problem 14.43 page 600 Problem 43 page 192 Introduction The owner of a moving company would like to develop a model of predicting the labor hours that is required to complete a move by using the number of cubic feet moved and whet

    Explanation of a Regression Analysis Question

    Suppose we have the following information from a simple regression: b0 = 117.4 b1 = -14.39 sb0 = 44.17 sb1 = 3.20 n = 300 x = 4.3 SST = 17,045 SSE = 12,053 a. What is the coefficient of determination? b. What is the correlation coefficient? c. What is the sample mean of y? d. What is the value of the sample tes

    Calculation of Regression Coefficients

    It is hypothesized that the number of bottles of an imported premium beer sold in city restaurants depends linearly on the average cost of meals in these restaurants. The following results were obtained for a sample of n = 20 restaurants of approximately equal size: x = 30 y = 18.8 Var(x) = 412 Cov(x,y) = 212 Where: y

    Bank Loan Data Set Analysis - SPSS

    Please provide recommendations to a company based on the data. The dataset provided is information on applicants for a bank loan. The bank is seeking advice as to their current loan approval guidelines Based on the dataset, what recommendations can be made to the bank? should the bank consider lowering their approval standards,