Scatter Plots and Correlation Coefficients
Not what you're looking for?
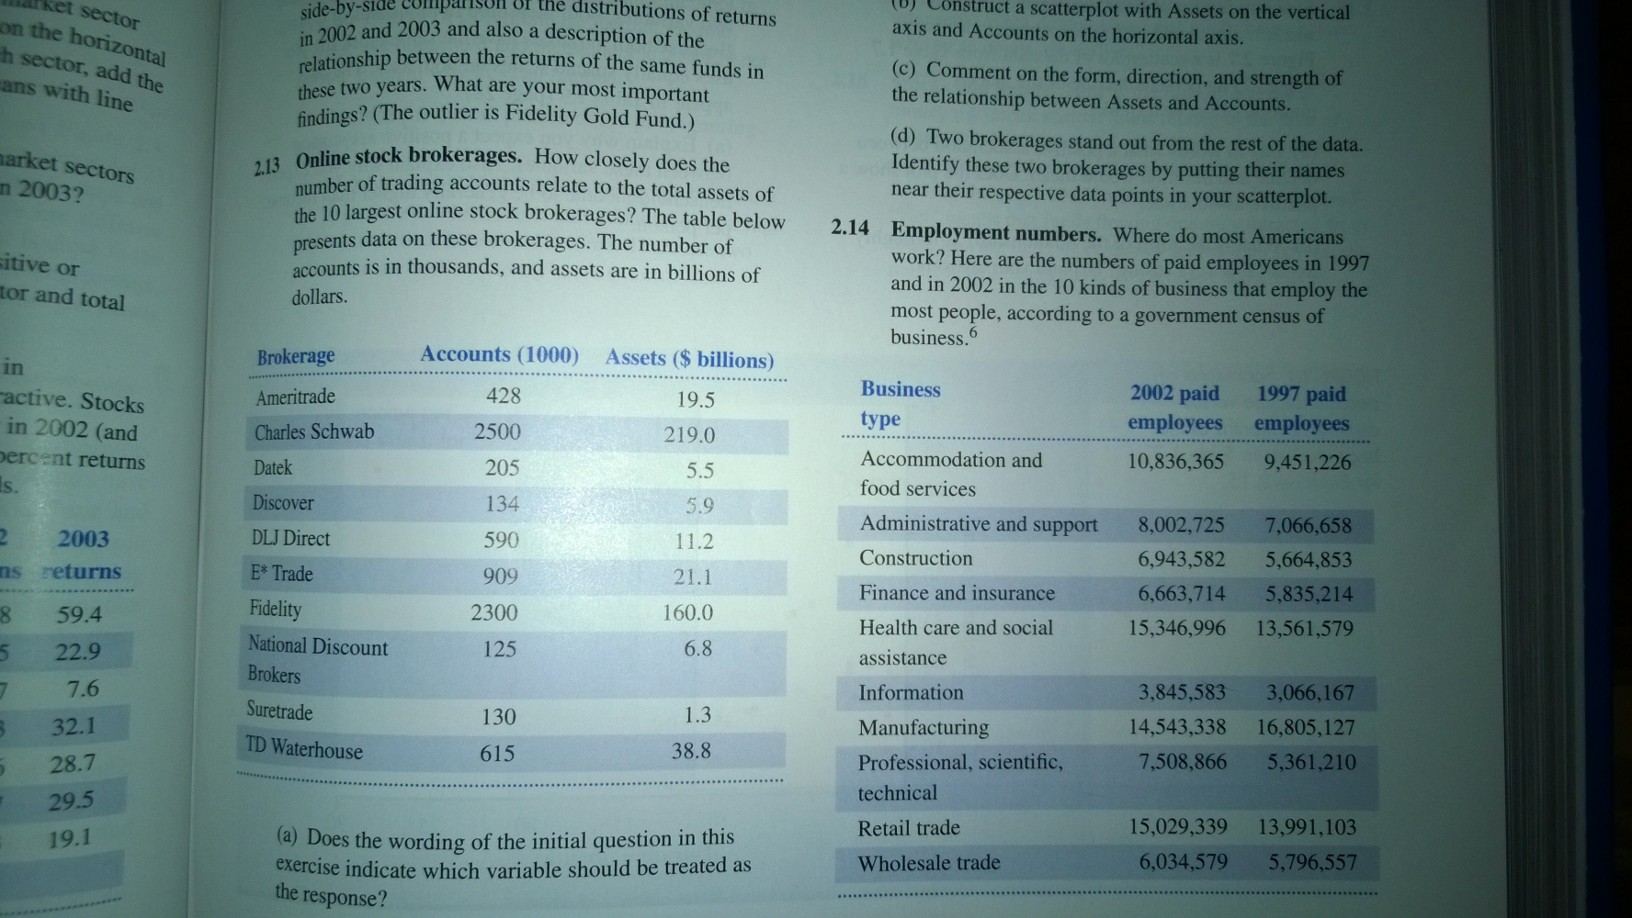
Question 1: Problem 2.13 from the text. Use Excel to construct your scatter plot. Write your answers to the questions in a word document. Include the scatter plot you created in your word document.
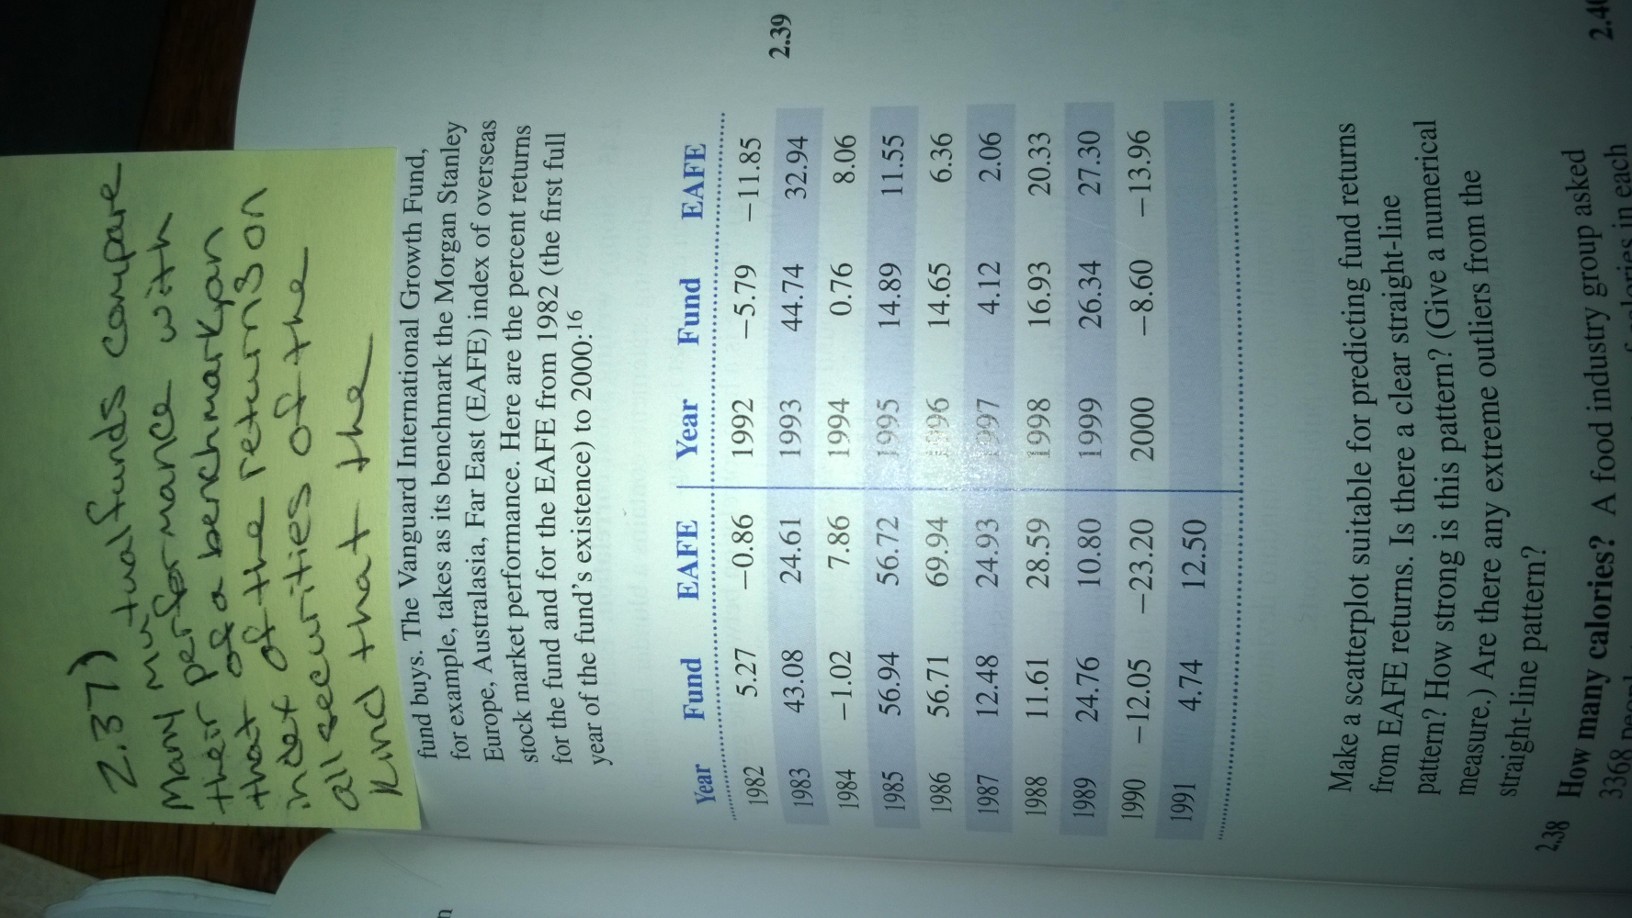
Question 2: Problem 2.37 from the text. Use Excel to construct a scatter plot. Compute the correlation coefficient by using columns in excel. You may use excel to do the hand computations. In other words you may use excel to sum up the column compute the squares of each column, etc. Answer any question in a word document.
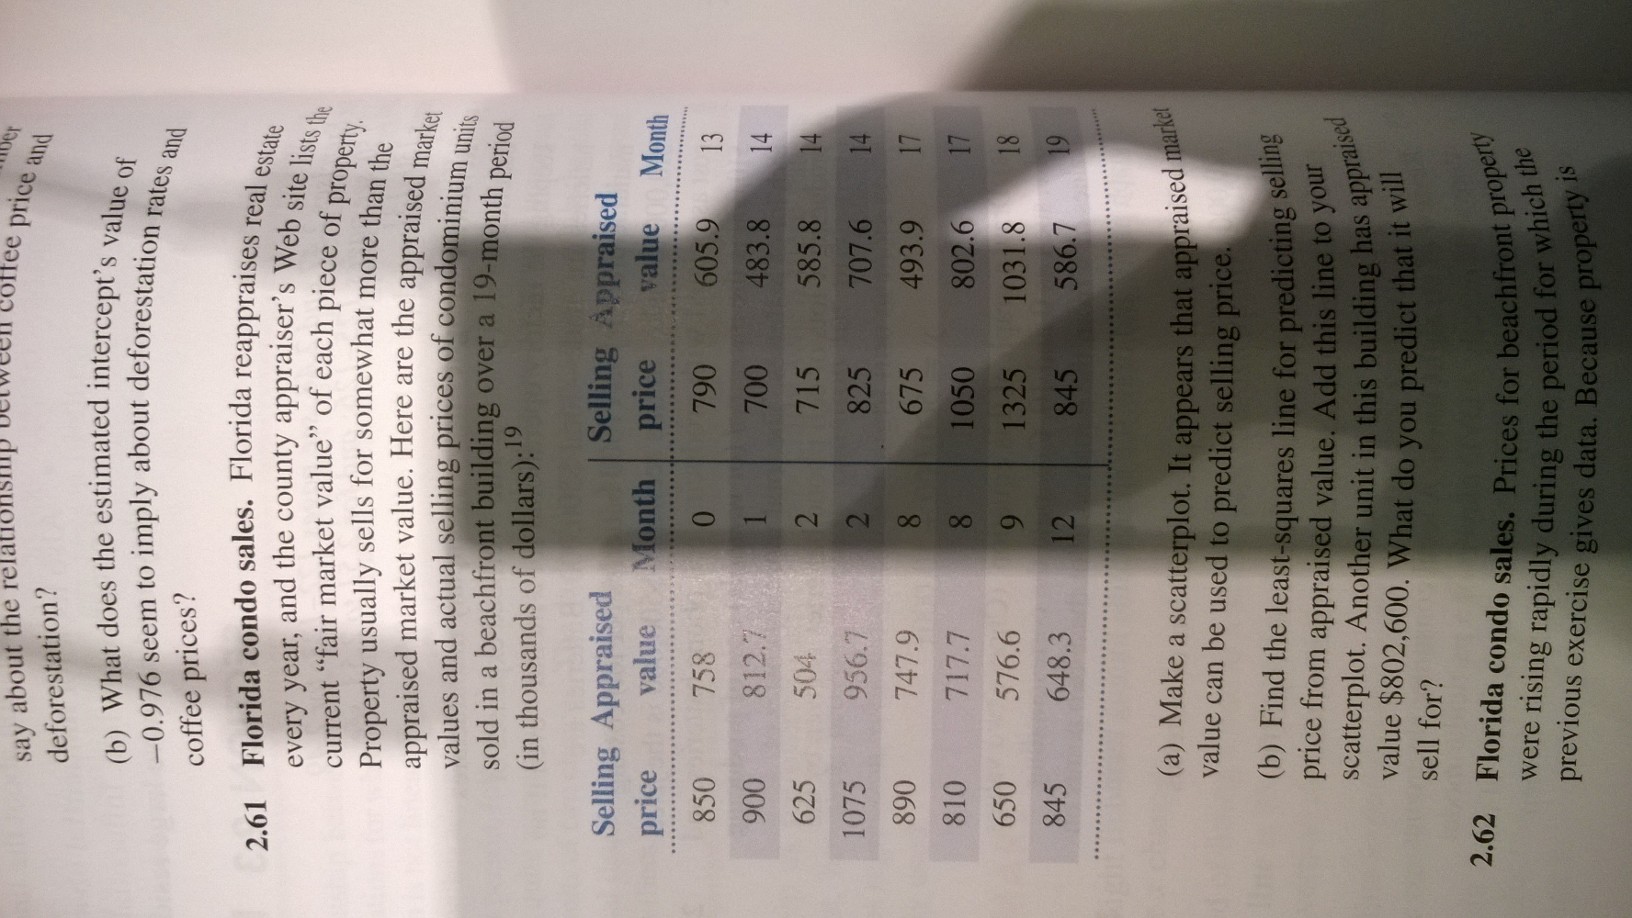
Question 3: Problem 2.61 from the text. Use Excel to perform all of the computations and upload your work.
Purchase this Solution
Solution Summary
This solution is comprised of a detailed explanation for correlation coefficient and scatter plots. The data analysis tool is used for the correlation analysis in Excel, correlation coefficient is also calculated manually by showing all the formulas and calculations. Full interpretation is given for correlation and scatter plots.
Purchase this Solution
Free BrainMass Quizzes
Measures of Central Tendency
Tests knowledge of the three main measures of central tendency, including some simple calculation questions.
Know Your Statistical Concepts
Each question is a choice-summary multiple choice question that presents you with a statistical concept and then 4 numbered statements. You must decide which (if any) of the numbered statements is/are true as they relate to the statistical concept.
Measures of Central Tendency
This quiz evaluates the students understanding of the measures of central tendency seen in statistics. This quiz is specifically designed to incorporate the measures of central tendency as they relate to psychological research.
Terms and Definitions for Statistics
This quiz covers basic terms and definitions of statistics.