Explore BrainMass

Explore BrainMass

    Linear Regression

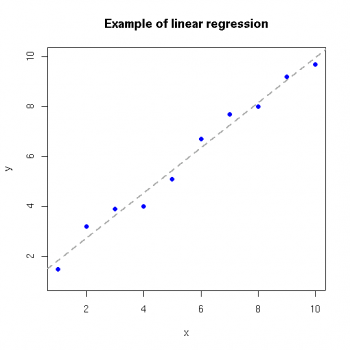
    Linear regression is an approach to model the relationship between a scalar dependent variable y and one or more explanatory variable denoted X. The case of one explanatory variable is called simple linear regression. For more than one explanatory variable, it is called multiple linear regressions. In linear regression, data is modeled using linear predictor functions, and unknown model parameters are estimated from the data. Such models are called linear models.

    Linear regression was the first type of regression analysis to be studied rigorously, and to be used extensively in practical applications. This is due to the fact models depend linearly on their unknown parameters are easier to fit than models which are non-linearly related to their parameters; also because the statistical properties of the resulting estimators are easier to determine.

    Standard linear regression models with standard estimation techniques make a number of assumptions about the predictor variables, the response variables and their relationships. Numerous extensions have been developed that allow each of these assumptions to be relaxed and sometimes entirely eliminated. Numerous extensions of linear regression have been developed, which allow some or all of the assumptions underlying the basic model to be relaxed.  

    A large number of procedures have been developed for parameter estimation and inference in linear regression. These methods differ in computational simplicity of algorithms, presence of a closed-form solution, robustness with respect to heavy-tailed distributions, and theoretical assumptions needed to validate desirable statistical properties such as consistency and asymptotic efficiency.

    Linear regression has many application including biological, behavioral and social sciences. It is used to describe possible relationships between variables. Its ranked as one of the most important tools used in these disciplines. 

    © BrainMass Inc. brainmass.com March 18, 2024, 6:10 pm ad1c9bdddf

    BrainMass Categories within Linear Regression

    Simple Linear Regression

    Solutions: 30

    Simple linear regression is the least squares estimator of a linear regression model with a single explanatory variable.

    Ordinary Least Squares

    Solutions: 13

    Ordinary least squares is a method for estimating the unknown parameters in a linear regression model.

    General Linear Model

    Solutions: 25

    The generalized linear model is a flexible generalization of ordinary linear regression that allows for response variables that have other than a normal distribution.

    Bayesian Regression

    Solutions: 0

    Bayesian linear regression is an approach in which the statistical analysis is undertaken within the context of Bayesian inference.

    BrainMass Solutions Available for Instant Download

    Linear Regression Analysis Prediction

    Scenario: You are consultant for the Excellent Consulting Group. Your client wants to be able to forecast sales on a monthly basis and believes that there is a valid relationship between sales and the number of hits on their website during the previous month. To test this theory, the client has collected data on sales of one of

    Multiple Regression Analysis

    • Task 5: A study was carried out to explore the relationship between Aggression and several potential predicting factors in 666 children who had an older sibling. Variables measured were Parenting Style (high score = bad parenting practices), Computer Games (high score = more time spent playing computer games), Television (hi

    Run a Multiple Linear Regression

    1. Using the survey5ED.sav data set and codebook run a Multiple Linear Regression. Use the scale variables computed as the independent variables and the dependent variable as indicated in the codebook. Assume that all assumptions have been met. Report the following information in your writeup, include all SPSS: • Comput

    linear regression and chi sq

    1. Given the following data where city MPG is the response variable and weight is the explanatory variable, explain why a regression line would be appropriate to analyze the relationship between these variables: The linear regression line will show the relationship between the MPG and weight. It will also show the value of depe

    steps on performing simple regression

    A uranium mining company has recorded its monthly profit and the average price of uranium for each month over a period of 24 months. The recorded data is in the attached file. It is assumed that a simple linear regression will determine the relationship between the average monthly uranium price and monthly profit. The followi

    Regression Analysis: Songs

    IPods (or iPod Apps on iPhones/iPod's) are incredibly popular for listening to music on the go. The music that you keep on an iPod can be stored in several different formats. Two popular formats are AIFF (Audio Interchange File Format) and AAC (Advanced Audio Coding). Files on an iPod can be in either of these formats, or both.

    Linear and Exponential Relation

    If a company took 100 hours to assemble their first unit and 85 hours to assemble the second unit, we might expect it to take: 70 hours to assemble the third unit. 72.25 hours to assemble the fourth unit. 72.25 hours to assemble the third unit. 70 hours to assemble the fourth unit.

    Correlation and Simple Linear Regression Using SPSS

    1. Use SPSS to provide key descriptive statistics for each continuous and ordinal variable (mean, median, standard deviation) in a table format. Provide a frequency table for categorical variables. Briefly describe the results in your tables. 2. Use SPSS to provide bivariate analysis. Compute multiple correlation coefficient

    Descriptive Statistics, Bivariate Analysis, and Linear Regressions

    1. Using SPSS conduct descriptive statistics and provide a brief report. Your report should include descriptive statistics on all pertinent variables in the dataset (i.e. frequencies/percentages for nominal data; mean/median and standard deviations for continuous data). Include relevant tables in your write-up of the descriptiv

    Regression Model Vs. Computerized Regression Routine

    What are the advantages and disadvantages of regression models in comparison to using a computerized regression routine? Give examples. What types of economic relations do managers take an interest in? Give examples and explain why they are interesting to managers.

    Regression Model for The Undrained Strength of Some Thawed Permafrost Soils

    The article "The Undrained Strength of Some Thawed Permafrost Soils" (Canadian Geotechnical Journal, 1979, pp. 420-427) contained the following data on undrained shear strength of sandy soil (Y, in kPa), depth (X1, in meters) and water content (X2, in percent). State and test the hypothesis for significance of regression B1, B2,

    Hypothesis Testing and Linear Regression Analysis

    Please assist answering the below statistical analysis questions: 1) Explain the difference between the null and alternative hypothesis. Which one can be proven in a statistical sense? 2) Explain why it is always necessary to specify a fixed null value in the one-sample hypothesis test, while such specifications are generall

    Statistics Problem Set: Regression and Linear Programming

    6. A multiple regression analysis including 50 data points and 5 independent variables results in 40. The multiple standard error of estimate will be: a. 0.901 b. 0.888 c. 0.800 d. 0.953 e. 0.894 4. Sampling error is evident when: a. a question is poorly worded b. the sample is too small c. the sample is not random

    Linear Regression and Square Residuals

    The data file cps4_small.dat contains 1000 observations on hourly wage rates, education, and other variables. 1. Estimate the linear regression WAGE = B1 + B2EDUC + e and discuss the results. 2. Calculate the least square residuals and plot them against EDUC. Are any patterns evident? If assumptions SR1 - SR5 hold, should

    Solve: Line of Best Fit

    For the table that follows, answer the following questions: x........y 1..... -1/3 2.......-2/3 3........-1 4 ...... ___ a) Would the correlation between x and y in the table above be positive or negative? b) Find the missing value of y in the table. c) How would the values of this table be interpreted in terms of

    Simple Linear Regression Test

    Please state the regression model, the Sy.x, r2, and t*. Tell me if this regression model is reliable (or not) and why you believe that. If the model is reliable, make forecasts for years 11-15 and show me those forecasts. Setup: We make a control valve whose sales have been growing. The marketing manager believes that th

    Weinberger's problem using LP

    The Weinberger Electronics Corporation manufactures four highly technical products that it supplies to aeorspace firms that hold NASA contracts. each of the products must pass through the following departments before they are shipped: wiring, drilling, assembly, and inspection. The time requirement in hours for each unit produ

    Conducting a linear regression analysis

    Research has been conducted on the hours of television watched in a day and the age of the viewer. The following results were obtained. Age Hours of Television 30 2 65 7 72 6 41 4 a) Find the least squares regression line by deciding which are the app

    Forecasting: Develop a Linear Regression Model

    Apperson and Fitz is a chain of clothing stores that caters to high school and college students. It publishes a quarterly catalog and operates a Web site that features provocatively attired males and females. The Web site is very expensive to maintain, and company executives are not sure whether the number of hits at the site re

    Application of Linear Regression

    The management of a chain of fast food restaurants wants to investigate the relationship between the daily sales volume (in dollars) of a company restaurant and the number of competitor restaurants within a 1 mile radius. The following data have been collected: Number of competitors within 1 mile Sales 1 3600 1 3300 2 3100

    Cost Accounting: Favata, Trustme Vehicle, Konrade's Engine, Merriamn Company

    See attached file for better format. Favata Company has the following information: Month Budgeted Sales June $60,000 July 51,000 August 40,000 September 70,000 October 72,000 In addition, the cost of goods sold rate is 70% and the desired inventory level is 30% of next month's cost of sales. Prepare a purchas

    Adriana Corporation Method of estimating costs: Simple Regression

    5-26: Method of estimating costs: high-low Adriana Corporation manufactures football equipment. In planning for next year, the managers want to understand the relation between activity and overhead costs. Discussions with the plant supervisor suggest that overhead seems to vary with labor-hours, machine-hours, or both. The fo

    Discuss: Statistical Variation and Regression Methods

    1.What are the implications of statistical variation? Why are we interested in understanding and measuring variation? Besides using variation in the world of quality, there are also social implications. For example, what does statistical variation suggest about how we ought to judge and treat ourselves and others? Cite an exa

    Linear Regression of Monthly Electrical Usage

    Estimate the relationship between monthly electrical power usage (Y) and home size (X) using the data in the file P11_13.xlsx. Interpret your results. How well does a simple linear regression model explain the variation in monthly electrical power usage?

    Data Analysis on Soft Drink Study

    Producing analysis as part of soft-drink industry study. Help with the following would be appreciated: a) Plot data b) Linear trend line (simple regression) and coefficient significance c) Quadratic trend line (Y=a+bt+ct2) and significance of coefficients d) Estimated exponential trend line . Values of a+b e) Calculate Me

    Linear Programming Problem for Print Media Advertising (PMA)

    Print Media Advertising (PMA) has been given a contract to market Buzz Cola via newspaper ads in a major southern newspaper. Full-page ads in the weekday editions (Monday through Saturday) cost $2000, whereas on Sunday a full-page ad costs $8000. Daily circulation of newspaper is 30,000 on weekdays and 80,000 on Sundays. PMA