Explore BrainMass

Explore BrainMass

    Hypothesis Testing

    Hypothesis testing is an integral topic in statistics and is conducted to test a population parameter or assertion for one or multiple samples. These hypotheses are generally based off of a theory or argument and tested using data collected from the samples.

    The first step in hypothesis testing involves setting up the null and alternative hypotheses. The null hypothesis is written first and just as the name implies, this hypothesis claims that there is no difference or relationship between the observations being tested. Thus, the null hypothesis when written out numerically, always involves an equals (=) symbol.

    The alternative hypothesis is written next and is the exact opposite of the null statement. Depending on the claim being tested, the alternative hypothesis can either propose a relationship in which one observation is greater than the other, less than the other, simply not equal to the other or a combination of those possibilities.

    The alternative hypothesis is important for establishing whether the hypothesis test is characteristic of a left-tailed test, right-tailed test or 2-tailed test. The diagram below displays the probability density function for each type of test. 

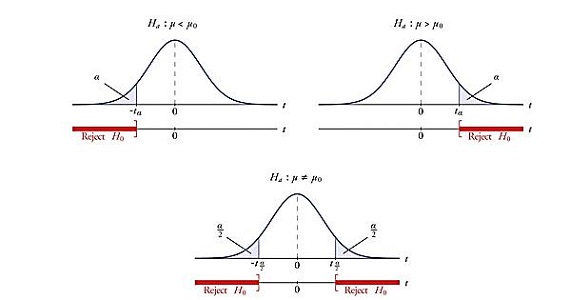
    Figure 1.  In this case, the claim is based from mean values. The null hypothesis is denoted by μ and the alternative hypothesis is represented by μo. The left hand corner diagram represents the left-tailed test, the figure in the middle is representative of the two-tailed test and the distribution curve on the right shows the claim for a right-tailed test. Please view the references for the image credit.

    Once the hypotheses are constructed, the next step involves setting the criterion for testing, which essentially means the significance level. Generally the significance level is set at 5%, but it is not restricted to this value. The significance value is dependent on the situation being investigated. Note, that in a two-tailed test, this 5% significance level is shared by both tails, so each tail represents a significance level of 2.5%.

    The final steps involve computing the test statistic and then making a decision on the claim. There are two decisions which can be made: the null hypothesis can either be rejected or a researcher can fail to reject it. This decision is based on the calculation of a p-value. If the p-value is less than or equal to 5%, the null hypothesis is rejected.


    References:

    Image Credit: Shafer, D.S. and Zhang, Z. (2014). Small Sample Tests for a Population Mean. Retrieved from: http://2012books.lardbucket.org/books/beginning-statistics/s12-04-small-sample-tests-for-a-popul.html


    © BrainMass Inc. brainmass.com March 18, 2024, 5:30 pm ad1c9bdddf

    BrainMass Categories within Hypothesis Testing

    Frequentist Inference

    Solutions: 1,758

    In the study of statistics, frequentist inference represents one of the main schools of thought in discussing the frequency and/or proportion of data from which conclusions are drawn.

    Parametric Tests

    Solutions: 1,089

    Parametric tests are statistical tests based on a set of assumptions about the probability distribution of a data set and this allows for a researcher to make inferences on the parameters of interest.

    Type I and Type II Errors

    Solutions: 132

    Type I and Type II errors are measures which are directly linked with hypothesis testing and result from a researcher assessing the claim being tested inaccurately.

    BrainMass Solutions Available for Instant Download

    Male and Female Runners

    CASE STUDY: 10000 METER RACE AT THE 2016 RIO OLYMPICS In 10000 meter race, runners complete over 25 laps or a 400 meter track. It is the longest track running event held. The men's 10000 meter began at the 1912 Olympics. It was 1988 (over seventy years later) before the women's 10000 meter was added to Olympic competition.

    Using Statistical Significance Tests

    Using Statistical Significance Tests Overview: Suppose a group of U.S. election reformers argues that switching to a system based on proportional representation (PR) would significantly increase voter turnout. Skeptics claim that the reform wouldn't significantly affect turnout. The following table, which reports mean turnout

    Hypothesis Testing: Internet Usage for a Company

    1. Choose two test statistics and describe how they are used. 2. Using the author's data set, perform the following two hypothesis tests on statements from the author. Perform a hypothesis test to examine this statement by the author: "The average internet usage for a country in 2017 is 60%." ● Write a null hypothesis a

    Confidence Intervals at Harrigan

    Harrigan University is a liberal arts university in the Midwest that attempts to attract the highest quality students, especially from its region of the country. It has gathered data on 178 applicants who were accepted by Harrigan (a random sample from all acceptable applicants over the past several years). The data are in the f

    Adolescents and Providers

    A study was done looking at communication between adolescents with asthma and their health care provider. Forty-six providers from four pediatric practices in North Carolina agreed to participate in the study. Two clinics were in rural areas and two were in suburban areas of North Carolina. Adolescent patients who agreed to part

    Rock-Paper-Scissors

    The table below shows the choices made by 128 players on the first turn of a Rock-Paper-Scissors game. Recall that rock beats scissors which beats paper which beats rock. A player gains an advantage in playing this game if there is evidence that the choices made on the first turn are not equally distributed among the three optio

    z-test for the Population Proportion

    The objectives of this activity are: 1. To give you guided practice in carrying out a hypothesis test about a population proportion. (Note: This hypothesis test is also called a z-test for the population proportion.) 2. To learn how to use statistical software to help you carry out the test. Background: This activity

    Identifying type of Hypothesis Test to be used in a situation

    For each of the following scenarios, identify the appropriate statistical test to be used. a) In a test of the decay theory of memory, participants memorized a list of nonsense syllables and were tested for recall after one hour and then four hours. What statistical test should be used to test the null hypothesis that dela

    Linear Regression Project in Excel

    For each of the two majors: 1. Create a scatter diagram of Y = 'Annual % ROI' against X = 'Cost'. Include the trendline and the coefficient of determination right on the graph. See Week 1 hints for assistance. 2. Calculate the estimated 'Annual % ROI' when the 'Cost' (X) is $160,000. Show your work. 3. Conduct a full h

    Hypothesis Test: Grades and Note Use

    A professor is wondering whether allowing students to use their notes during tests improves performance. She uses one of her classes as a control group and does not allow them to use their notes, and she allows her second class to use their notes while taking their exams. Below are the grades for each 12 person class. Is there a

    Car Details Excel

    • State the hypothesis in a sentence (for example): 50% of the 1st graders will pass the swim test. • Express that idea using scientific notation (for example): Null Hypothesis - H0: p = 50, Alternate Hypothesis - HA: p ≠ 50 • t or z test used to evaluate the hypothesis • Alpha (α) level • P value •

    Hypothesis Testing 3A

    11.) A random sample of 1,600 adults in a certain country shows that 72% have smart phones. What is a 80% confidence interval for the percentage of adults having smart phones in this country? a. 72%±1.85% b. 72%±1.44% c.72%±2.24% d.72%±1.11% 12.If 48% of the 400 voters sampled voted for candidate A over candi

    Levels of Oxygenation: T-Test

    A drug company is measuring levels of oxygenation in patients after receiving a test medication. As the researcher, you are interested in whether Group I, which received the medication, has the same oxygenation levels as Group II, which did not. 1. Group 1: 2,3,3,4,4,7,8,9 2. Group 2: 1,2,2,3,4,4,5,5,6,8 Use Excel to run a t-

    3 Hypothesis test questions

    Question 1 - the concepts Professor Walters knows that the mean score on the midterm exam from all the years he has been teaching is 83%. Kennedy was in his most recent class, and his class's mean score on the final exam was 81%. Kennedy decided to run a hypothesis test to determine if the mean score of his class was differen

    Hypothesis test project

    Think of a problem you may be interested in that deals with a comparison of two population means. Propose either a confidence interval or a hypothesis test question that compares these two means. Gather appropriate data and post your problem (without a solution) in the discussion topic. Later, respond to your own post with the s

    Hypothesis Test: Critical Value, Decision Rule, Test Statistic

    Hypothesis testing is used in business to test assumptions and theories. These assumptions are tested against evidence provided by actual, observed data. A statistical hypothesis is a statement about the value of a population parameter that we are interested in. Hypothesis testing is a process followed to arrive at a decision be

    Regression Analysis in Excel: The Tire Rack

    The Tire Rack, America's leading online distributor of tires and wheels, conducts extensive testing to provide customers with products that are right for their vehicle, driving style, and driving conditions. In addition, the Tire Rack maintains an independent consumer survey to help drivers help each other by sharing their long-

    Confidence Intervals, Hypothesis Testing, Sample Size

    Comparing Two Population Means In 2004, the Mars Candy Company stated on their Web site that their 1.69 oz. package of M&M's contained an average of at least 53 candies and that 14% of all M&Ms manufactured were yellow. Students in a Math 1040 statistics class at the Salt Lake Community College were asked to determine if the

    Regression Analysis for Performance Lawn Equipment

    In reviewing the PLE data, Elizabeth Burke noticed that defects received from suppliers have decreased (worksheet Defects After Delivery). Upon investigation, she learned that in 2010, PLE experienced some quality problems due to an increasing number of defects in materials received from suppliers. The company instituted an init

    Histogram, Statistical Analysis, Hypothesis Tests

    Task 1 1) For the data in the worksheet "Blade Weight", what is the sampling distribution of the mean, the overall mean, and the standard error of the mean? Is a normal distribution an appropriate assumption for the sampling distribution of the mean? (Also use Histogram chats to Illustrate your answer in the Excel worksheet

    Hypothesis Test Questions

    1 Errors & Significance A STAT 200 instructor wants to compare the final exam scores of students taught using two different curricula. She obtains a sample of 500 students. She randomly assigns 250 students to a traditional curriculum and 250 students to a new curriculum. It is hypothesized that the new curriculum will lead t

    STA108 Chapters 16,17: General Statistics

    1. A level 0.95 confidence interval is a. any interval with margin of error ± 0.95. b. a range of values computed from sample data that will contain the true value of the parameter of interest 95% of the time. c. a range of values with margin of error ± 0.95, which is also correct 95% of the time. d. a range of values comp

    PPG & MPG: correlation coefficient, competing hypothesis, value

    The following table lists the National Basketball Association's leading scorers, their average points per game (PPG), and their average minutes per game (MPG) for 2008; the data are also available on the text website, labeled Points. PPG MPG D. Wade 30.2 38.6 L. James 28.4 37.7 K. Bryant 26.8 36.1 D. Nowitzki 25.9 37.3

    Confidence Interval and Tests of Hypotheses

    1. The CDC estimated that influenza vaccination reduced the risk of flu illness in 600 of 1000 randomly sampled individuals during seasons when most circulating flu viruses are well-matched to the flu vaccine. Construct the 97% confidence interval for the population proportion. State your conditions, interpret your interval, and

    Inference for Two Samples

    1. Market researchers working for a large fitness company want to know if male and female patrons differ in terms of how many hours per week they spend at the gym. At their gym, customers have ID cards that they use to sign in and out of the gym, so the researchers are able to obtain data concerning how long each customer was i

    EPA and Statistics self-efficacy

    1. The Environmental Protection Agency (EPA) is testing tap water in one community. If they find evidence that the average level of lead is greater than 15 parts per billion (ppb) they will order that the water be turned off and that residents be given free bottled water until the problem is fixed. A. State the null and altern

    Chi-Squared and Regression

    A pharmaceutical company develops a new drug that helps obese patients who are not currently diabetic avoid contraction of diabetes. The conduct conducts a trial splitting a sample of 135 patients into two groups, a drug group and a placebo group. They then monitored the patients for 5 years and noted how many patients in each g

    Z-Tests and T-Tests

    The percent of hospitals in Region 3 of the northwestern United States that reached maximum occupancy at least once in January 2015 was 82%. The regional administration wants to conduct a study to determine if the rate has changed. Before conducting the study, she assumes that the average rate is still 82%. She calls a sample of

    Pallet and Phone Population Examples

    Refer to the Excel file Pallet to address all the questions below: The file contains the weight in pounds from a sample of 368 pallets of Boston shingles and 330 pallets of Vermont shingles. 1. For the Boston shingles, is there evidence at the 0.05 level of significance that the population mean weight is different from 3150 po

    Average: Daily Use of an Exercise Machine

    If you were read the result of a study showing that daily use of a certain exercise machine results in n average 10-pound weight loss, what is that telling us? What more would you want to know about the numbers in addition to the average?