Explore BrainMass

Explore BrainMass

    Parametric Tests

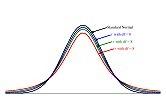
    Parametric tests are statistical tests based on a set of assumptions about the probability distribution of a data set and this allows for a researcher to make inferences on the parameters of interest. It is the shape of the distribution which these assumptions are based off of, so for instance, with respect to the normal distribution a bell shaped curve is assumed. Certain parametric tests, such as t-tests and an ANOVA test, assume a normal distribution1.

    These assumptions are crucial because if they are not met, non-parametric tests must be used. Furthermore, comparisons between groups cannot be directly made if these assumptions are not met. Although, there are a few tests which can still be utilized even if all of the assumptions are not met and thus, these tests act as exceptions. For instance, an F-test can still be used if the first two assumptions are violated, only if the number of values in the data sets being compared is equal1.

    There are three assumptions which need to be followed1:

    1. Normality: The observations need to be taken from normally distributed populations.
    2. Homogeneity of variance: The variances of the populations being compared needs to be equal.
    3. Scale: An interval measurement scale or ratio scale must be used.

    Since the variances (and also standard deviations) of the populations need to be the same, data sets with outliers cannot be used. Outliers skew a population’s data and increase the variance value. Commonly used parametric tests in statistics include: t-tests, Z-tests and F-tests.


    References:

    1. Foster, J.J. (2006). Parametric Tests. Retrieved from: http://srmo.sagepub.com.proxy.queensu.ca/view/the-sage-dictionary-of-social-research-methods/n142.xml. 

    © BrainMass Inc. brainmass.com March 18, 2024, 6:10 pm ad1c9bdddf

    BrainMass Categories within Parametric Tests

    Z-Test

    Solutions: 366

    A Z-test is a type of parametric statistical test utilized for comparing two populations, which have large population sizes and the same variance values, to determine if their population means differ.

    Student's t-Test

    Solutions: 647

    The Student’s t-Test is a statistical hypothesis test based on the t-distribution which assesses whether the means of two different groups are statistically different from each other.

    F-Test

    Solutions: 63

    An F-test is a form of hypothesis testing used for comparing variances using the F-distributions, with varying degrees of freedom.

    BrainMass Solutions Available for Instant Download

    Testing at the 1% level: Autism Spectrum Disorder Diagnosis

    Are there more children diagnosed with Autism Spectrum Disorder (ASD) in states that have larger urban areas over states that are mostly rural? In the state of Pennsylvania, a fairly urban state, there are 245 eight year olds diagnosed with ASD out of 18,440 eight year olds evaluated. In the state of Utah, a fairly rural state

    Finding sample proportions

    A random sample of women is obtained, and each person in the sample is asked if she would purchase a new shoe model. To determine if the new shoe model would have sales of at least 25% to meet corporate profit objectives, the following hypothesis test is performed at a level of α = 0.03 using p Hat as the sample proportion of w

    ANOVA - Test the waiting time in four tax offices

    Management at the Kansas City Corporate office for tax prepration wants to accomplish a business objective by conduting a study of the waiting time in its tax offices in different states. The corporate office has offices all over the U.S. The corporate office wants to reduce the waiting time for a client sit

    Two-Way ANOVA with Replication

    A student team in a business statistics course performed a factorial experiment to investigate the time required for pain-relief tablets to dissolver in a glass of water. The two factors of interest were brand name (Equate, Kroger, or Alka-Seltzer) and temperature of the water (hot or cold). The experiment consisted of four

    Two-Way ANOVA with Replication

    The effects of developer strength (factor A) and development time (factorB) on the density of photographic plate film were being studied. Two strengths and two development times were used, and four replicates in each of the four cells were used, and four replicates in each of the four cells were evaluated. The results ( with la

    One way anova and levene's test for testing the variance among groups

    An advertising agency has been hired by a manufacturer of pens to develop an advertising campaign for the upcoming holiday season. To prepare for this project, the research director decides to initiate a study of the effect of advertising on product perception. An experiment is designed to compare five different advertisement

    Independent Variable t-test

    Perform an independent t test to assess your hypotheses above (note that many versions of SPSS use the term "independent samples t test" rather than simply "independent t test"). Write one or two paragraphs that describe the dataset, gives your hypothesis, and presents the results of the independent sample t test. Be sure that

    The solution gives detailed steps on solving various questions on fundemantals of statistics. The topic includes correlation coefficient, coefficient of determination, SSE, t statistic so on. All the formula and calcuations are shown and explained.

    1. A data set with 7 observations yielded the following. Use the simple linear regression model. Greek letter Capital Sigma X =21.57 Greek letter Capital Sigma X2 =68.31 Greek letter Capital SigmaY =188.9 Greek letter Capital Sigma Y2 =5,140.23 Greek letter Capital Sigma XY =590.83 Calculate the Correlation coeff

    Z-Scores and Standard Deviation

    Using the sample data collected (see attached), consider the variables (satisfaction with job and satisfaction with the economy) and perform the following: Determine what scores correspond to the top and bottom 10% and 25% of the data. Begin with the z-score formula and transform the formula so that you are solving for the