Explore BrainMass

Explore BrainMass

    Probability

    Probability is a measure of how likely it is for an event to take place. Probabilities are often denoted by a value ranging between 0 and 1, where 0 represents an impossible event, while 1 represents an event that will definitely happen. Therefore, in this context, the higher the degree of probability, the more likely the event is going to happen.

    Before the probability of an event can be computed/measured, the sample space, denoted by the sign Ω, represents the set of all possible outcomes of a random variable. Events in probability are usually denoted by a letter. So for a given set of outcomes, the event may be labeled ‘A’; for another given set of outcomes, the event may be labeled ‘B’. In light of this, an event, either ‘A’ or ‘B’ is a subset of the sample space.

    In probability, there are other symbols used to describe composite events. The ∪ sign in A ∪ B denotes the union of two events. So A ∪ B denotes a composite event that occurs if either A or B occurs, or they both occur. The ∩ sign in A ∩ B denotes the intersection of two events. So A ∩ B denotes a composite event that occurs if both A and B occur. The A’ sign denotes an event that cannot occur with A. But one of A’ and A must occur.

    These concepts are used widely in an ever expansive area of study, such as mathematics, statistics, epidemiology and even philosophy. Thus, understanding the concepts of probability may prove to be a practical tool for anyone.

    © BrainMass Inc. brainmass.com March 18, 2024, 4:45 pm ad1c9bdddf

    BrainMass Categories within Probability

    Probability Density Function

    Solutions: 106

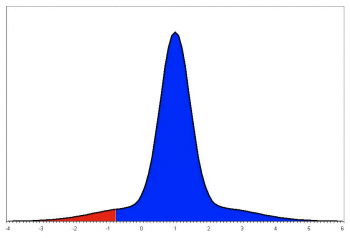
    Probability density function describes the probability of a random variable taking on a specific value.

    Cumulative Distribution Function

    Solutions: 22

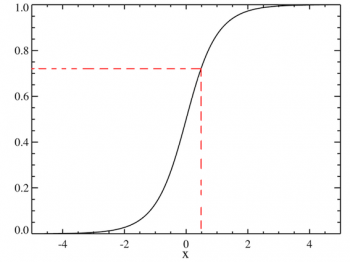
    Cumulative distribution function refers to the probability of a random variable X, being found lower than a specific value.

    Central Limit Theorem

    Solutions: 102

    The Central Limit Theorem is a statistical theory which describes a situation where the mean of all samples from the same population will approximately equal the mean of the parent population, given that the sample size is large and that the variance is finite.

    Geometric Probability

    Solutions: 9

    Geometric Probability refers to the probability involving geometric objects under stated conditions.

    Bayesian Probablity

    Solutions: 54

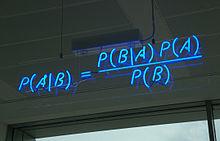
    Bayesian probability refers to the probability of an event given a level of certainty of an external factor relating to that event.

    BrainMass Solutions Available for Instant Download

    10 Probability Problems in EXCEL

    1. Lauren drinks a variety of soft drinks. Over the past month, she has had 17 diet colas, 3 cans of lemonade, and 5 cans of root beer in no particular order or pattern. a. Given this history, what is the probability that her next drink will be a diet cola? Lemonade? Root beer? b. What definition of probability did you use

    Connection between a rare genetic mutation and breast cancer

    Recent news articles have discussed the connection between a rare genetic mutation and breast cancer in women. One of the companies offering this BRCA genetic test is Quest, and this company claims a 97.5% accuracy rate. Only 200 women out of every 100,000 women carry the BRCA genetic mutation. Fill in the table using a sample p

    Expect to Win or Lose

    Suppose that you and a friend are playing cards and decide to make a bet. If your friend draws two aces in succession from a standard deck of 52 cards without replacing the first card, you give him $70.Otherwise, he pays you $10. If the same bet was made 15 times, how much would you expect to win or lose? Round your answer to

    Probability and Statistics Questions

    A telephone survey uses a random digit dialing machine to call subjects. The random digit dialing machine is expected to reach a live person 15% of the time. True or False: Each call is an independent random event. In two attempts, what is the probability of achieving...... exactly two successful calls? (success = reach a li

    Measuring Disease

    A causal relationship between cigarette smoking and lung cancer was first suspected in the 1920s on the basis of clinical observations. To test this apparent association, numerous epidemiologic studies were undertaken between 1930 and 1960. Two studies were conducted by Richard Doll and Austin Bradford Hill in Great Britain. The

    Normal distribution probability questions

    Problem 1. The commuter trains on the Red Line for the Regional Transit Authority (RTA) in Cleveland, OH, have a waiting time during peak rush hour periods of twelve (12) minutes. (a) What is the random variable? (b) Find the height of this uniform distribution. (c) Find the probability of waiting between four and five minu

    Relative Risk and Odds

    1. The following contingency table summarizes the relationship between exposure to a risk factor and development of a disease. a. Find the relative risk ratio to compare the risk of disease among exposed subjects to that of unexposed subjects. b. Find the odds ratio to compare the odds of disease among exposed subjects to that

    Random Variables and Probabilities: Timeshare Plan Example

    A marketing agency has developed three vacation packages to promote a timeshare plan at a new resort. They estimate that 20% of potential customers will choose the day plan, which does not include accommodations; 40% will choose the overnight plan, which one night at the resort; and 40% will choose the weekend plan which include

    Z-Scores and Percentiles for City Temperatures

    Below is the a set of temperatures measured in degrees Fahrenheit of randomly selected cities in September. You WILL need to use excel for some of the answers to this question. 68 50 99 73 79 80 82 95 73 84 86 92 45 90 See the attachment for the full questions. The mean temperature is: The standard deviation of the temp

    Constructing joint frequency tables for North-South Railways

    The new GM of North-South Railways initiated a drive to make sure that trains do run on time. He had collected data on 200 instances where the trains arrived late at the destination. Of these, 160 started late (SL) at the origin itself, where as the remaining 40 did start on time (SO), but reached the destination late. He had

    Chicken Eggs by Size

    Chicken eggs are sold according to their size. The chart shows how eggs are classified by their size. The eggs produced at Jen's Hen Farm and Rick's Chick Farm are normally distributed. The eggs produced at Jen's Hen Farm have a mean weight of 2.11 ounces and a standard deviation of 0.08 ounce. The eggs produced at Rick's c

    Tiger Shark Population

    Marine biologists in Florida are studying the tiger shark to determine the factors that are contributing to their diminishing population. Adult tiger sharks along the Atlantic Coast of Florida have a mean length of 11.5 feet with a standard deviation of 0.9 foot. Adult tiger sharks along the Gulf coast of Florida have a mean l

    African Lions, Normally Distributed

    The birth weights of African lions are normally distributed. The average birth weight of an African lion is 3.6 pounds with a standard deviation of 0.4 pound. 13. What percent of newborn African lions weigh less than 3 pounds? 14. What percent of newborn African lions weight more than 3.8 pounds? 15. What percent of newborn

    Microwave Popcorn, normally distributed

    The time to cook a bag of microwave popcorn is normally distributed with a mean of 3.5 minutes and a standard deviation of 0.6 minute. Suppose that you randomly select a microwave popcorn bag from the sample. Use the given information and the distribution to answer each question. Explain your reasoning. 8. What percent of

    Normal Distribution and Birth Weights

    A researcher recorded the birth weights of a sample of newborn babies. The average birth weight was 7.2 pounds and the standard deviation was 0.9 pound. The birth weights follow a normal distribution. 1. Label the number line so that the curve is a normal curve and follows the properties of the normal distribution. Include

    Hypothesis testing and scatter plots using Excel

    *Note: For problems 1 - 4, complete the 5-step process: Step 1: State the null hypothesis and the alternate hypothesis. Step 2: Select the level of significance. Step 3: Evaluate the test statistic. Step 4: Formulate a decision rule with critical value of test statistic. Step 5: Compare the test statistic to the critical

    confidence interval and Z

    A local university administers a comprehensive examination to the candidates for B.S. degrees in Business Administration. Five examinations are selected at random and scored. The scores are shown below. Grades 80 90 91 62 77 I am interested in the overall performance for all candidates of a B.S. degree. The populati

    Game Theory Critical Thinking

    Given the following payoff matrix, ( a) indicate the best strategy for each firm. ( b) Why is the entry-deterrent threat by firm A to lower the price not credible to firm B? ( c) What could firm A do to make its threat credible without building excess capacity? (Refer to Tables Sheet) NOTE: P10(a):The strategies for firm A

    Measure of Central Tendency

    Question 1 A family member can go to one of two local hospitals for brain surgery. Checking the history for the past year, you find that each of the two hospitals has performed brain surgery on 1000 patients. In hospital A 710 patients survived (71%). In hospital B 540 (54%) survived. Based on the numbers presented, which ho

    Normal distribution analysis

    Maximum and Minimum Temperatures Search the Internet for U.S. climate data. Choose the city in which you live. Click on the tab that reads "Daily." 1. Prepare a spreadsheet with three columns: Date, High Temperature, and Low Temperature. List the past 60 days for which data is available. 2. Prepare a hist

    NPV Investment Opportunity

    Scenario: You are an entrepreneur that has several business investments in real estate, restaurants, and retail stores. You are looking for your next investment opportunity for you and your private equity investment company. You have found two possible alternatives to invest in that will payoff in the next 10 years. Here are the

    Running for Office Polling Probability Worksheet

    New Competencia Demographic Data 1. Assuming no calls have been made to New Competencia residents yet, what is the probability that the first phone call will be to someone in McGovern's target population? 2. A few hours into your visit, the polling center has called 37 small business owners, 63 residents between ages 18-

    Normal Approximation in the Binomial Distribution

    The next North Carolina gubernatorial election will be held in 2016. Suppose that 52% of North Carolina voters actually support Candidate A in that election. a) What is the probability that a poll of a simple random sample of 100 NC voters will result in at least half of those polled favoring the other candidate? Use the no

    Home Free General Contractor Game Show

    Game Overview ● There are 15 toolboxes, each holding a prize of a set value. ● As the contestant, you must begin the game by randomly select one toolbox. The value hidden in this toolbox is what you will win if you choose to keep it throughout the game, but you will have multiple chances to trade it in for a guaranteed pri

    Confidence intervals using normal distribution

    Mimi was the 5th seed in 2014 UMUC Tennis open that took place in August. In this tournament, she won 80 of her 100 serving games. Based on UMUC sports Network, she wins 75% of ;the serving games in her 5 year tennis career. 1. Find a 90 % confidence interval estimate of the proportion of serving games Mimi won. (Show work an

    Determine the birthplace of a class of college students.

    A poll was taken to determine the birthplace of a class of college students. Below is a chart of the results. a. What is the probability that a female student was born in Orlando? b. What is the probability that a male student was born in Miami? c. What is the probability that a student was born in Jacksonville? Gender

    Revenue, cost and profit under competition and monopoly

    Competition: P = 8 Q= 2 Monopoly: P = 107.4 Q = 4.2 Find total revenue, total cost and profit. Competition: Qd= 1- .5p Qs = -2 + p TC = 20 + 4Q +Q(2) where (2) means squared. Find: TC,TR, P, Q and profit Monopoly: P = 120 -3Q TC = 20 + 10Q + 10Q(2) where (2) means squared Find: TC,TR, P, Q a

    Normal Distribution and Probability

    The Nordic Ecolabel is the official Ecolabel of the Nordic countries and was established in 1989 by the Nordic Council of Ministers.The Nordic Ecolabel evaluates a product's impact on the environment throughout the whole life cycle. The label guarantees among other things that climate requirements are taken into account, and tha

    Statistics: Probability and Binomial Distribution

    An airline has classified its customers as high-volume travelers (assumed to be business travelers) and low-volume travelers (assumed to be leisure travelers). Eighty five percent are high volume travelers. If five people are randomly selected from a list of customers, What is the probability none are high-volume travelers?