Explore BrainMass

Explore BrainMass

    Cumulative Distribution Function

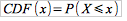
         A cumulative distribution function (CDF) is a distribution function for a random variable X that gives the probability that it will be less than or equal to a value x. That is to say that the cumulative distribution function can be defined formulaically as:

    An example of a CDF graph would look like such:

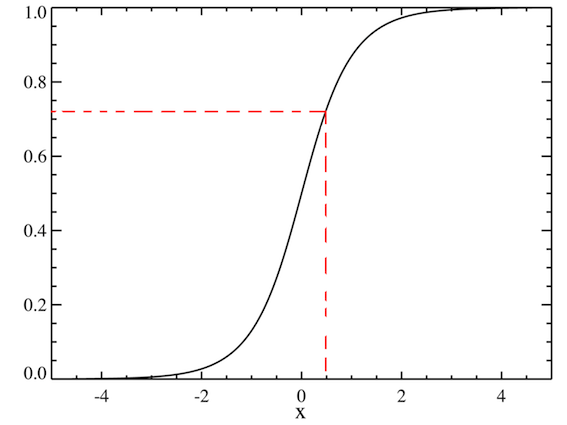
         For example, if we were to ask for CDF(0.5), we would find that it is equal to approximately 0.72 as shown by the dotted red line. This means that the probability for the variable X to be less than or equal to 0.5 is 0.72. Consequently the final point on the CDF will always be equal to one, because it is the probability that X will be less than or equal to its maximum value; the answer must be 100%. CDF's can be used to answer questions such as "What is the chance I will get at least 70% on this test? at least 80%? 90%?"


    © BrainMass Inc. brainmass.com April 20, 2024, 3:35 am ad1c9bdddf

    BrainMass Solutions Available for Instant Download

    Linear Regression Model: Cosmetic Surgery

    1. Reality TV and cosmetic surgery How much influence does the media, especially reality television programs, have on one's decision to undergo cosmetic surgery? This was a question of interest to psychologists. They went on and published an article in Body Image: An International Journal of Research (March 2010). In the s

    The Normal Distribution and Confidence Intervals

    Basic Statistics Name: Test 2- The Normal Distribution and Confidence Intervals 1) Assume that the distribution of heights of adult American men is normally distributed with mean 69 inches and standard deviation 2.8 inches. A Carefully label the x- and z-axes of the normal distribution. B. What percentage of men i

    Standard deviation of sampling distribution of the sample mean

    In a manufacturing process a machine produces bolts that have an average length of 3 inches with a variance of .03. If we randomly select three bolts from this process: What is the standard deviation of the sampling distribution of the sample mean?

    Find the probability of a male or has an unfavorable opinion

    In a local survey, 100 citizens indicated their opinions on a revision to a local land use plan. Of the 62 favorable responses, there were 40 males. Of the 38 unfavorable responses, there were 15 males. If one citizen is randomly selected find the probability of "a male or has an unfavorable opinion

    Joint PMF of Two Coins

    Flip a fair coin twice, i.e., {HH;HT;TH;TT}. Let X and Y be two random variables by X(HH) = X(HT) = 2; X(TH) = X(TT) = 1; Y (HH) =Y (TH) = 1; Y (HT) =Y(TT) = -1: (a) Plot the joint pmf and joint cdf for X and Y . (b) Are X and Y independent? Uncorrelated? (c) Define Z = XY . Plot the joint pmf and joint cdf for X and Z.

    Approximation to Binomial Distribution

    If np ≥ 5 and nq ≥ 5 estimate P (fewer than 2) with n= 13 and p= 0.4 by using the normal distribution as an approximation to the binomial distribution if np < 5 or nq <5 then state that the normal approximation is not suitable. Select the correct choice below and if necessary fill in the answer box to complete our choic

    Frequency Distribution, Histogram, Cumulative Percentage Polygon

    Hello, the attached file includes the total compensation (in $) of CEOs of large public companies in 2008. Using this data: A) Construct a frequency distribution and a percentage distribution. B) Construct a histogram and a percentage polygon. C) Construct a cumulative percentage distribution and plot a cumulative percentage

    Statistics: Binominal Distribution with Continuity Correlation for fair coin toss

    Suppose a fair coin is tossed n times. The probability of obtaining head and tail are the same because this is a fair coin. The proportion of heads is defined as the number of heads appeared divided by n. We can model this probability distribution by binominal distribution. For large n, the binominal distribution can be repla

    Give a mathematical expression for the probability density function of driving distance. Suppose you bid $12,000. What is the probability that you bid will accepted? What is the probability the random variable will assume a value between 45 and 55? Assume that the class has 60 students and that the examination period is 90 minutes in length. How many students do you expect will be unable to complete the exam in the allotted time?

    5. The driving distance for the top 100 golfers on the PGA tour is between 284.7 and 310.6 yards (Golfweek,March 29,2003). Assume that the driving distance for these golfers is uniformly distributed over this interval. a. Give a mathematical expression for the probability density function of driving distance. b. What is the pr

    Cumulative Distribution Function, Mean and Variance

    A r.v. X is called a Laplace r.v. if its pdf is given by fx(x) = ke ^(-lambda |x|) lambda>0, -infidenity< x < infidenty where k is a constant. (a) Find the value of k. (b) Find the cdf of X. (c) Find the mean and the variance of X.

    Applied Cumulative Distribution Function Problem ( cdf )

    A consumer organization that evaluates new automobiles customarily reports the number of major defects... Calculate the following probabilities directly from the cdf... Please see the attached file for the fully formatted problems.

    Probability : Acceptable Range of Values and Cumulative Distribution Function

    1) A manufacturer of flashlight batteries wishes to control the quality of its product by rejecting any lot in which the proportion of batteries having unacceptable voltage appears to be too high. To this end, out of each large lot (10,000 batteries), 25 will be selected and tested. If at least 5 of these generate an unacceptab

    Cumulative Distribution Function

    The attachment represents the cumulative dist. funct. for a random variable x. From the graph, find P(2<=x<=3): Must be one of the following answers: a.) 0.6 b.) 0.2 c.) 0.4 d.) 0.8

    Summarize the data by construction the following: a frequency distribution, a relative frequency distribution, a cumulative frequency distribution, a cumulative relative frequency distribution and an ogive. Describe the pattern in the graph for the problem. Compute appropriate summary statistics for the data in problem.

    19. The data for the numbers of units produced by a production employee during the most recent 20 days are shown here. 160 170 181 156 176 148 198 179 162 150 162 156 179 178 151 157 154 179 148 156 Summarize the data by construction the following: a. a frequency distribution b. a relat

    probability density function to find the cumulative distribution

    You are told that the continuous random variable X is exponentially distributed with parameter a (a > 0). A standard result then says that the probability density function of X is (see attachment) f(x) = aexp(-ax) for x > 0. Use this to prove that the corresponding cumulative distribution function F(x) (sometimes referred