The Mann-Whitney U-Test is a nonparametric test which is analogous to the student’s two-sampled t-test. This statistical test is utilized to determine if a difference exists between the two samples being compared. The samples do not need to originate from normally distributed populations, but they should come from populations with similar distributions.
The Mann-Whitney U-Test is conducted using ordinal data, data which is based on rank sums. Since it is a nonparametric test, it analyzes the difference between the medians of two data sets. In addition to utilizing nonparametric, ordinal data, this statistical test should be used when there are more than 5 pieces of data in each sample, but fewer than 20 data pieces in total.
As with any statistical test, the first step in using the Mann-Whitney U-Test involves setting up the null hypothesis. The null hypothesis in a Mann-Whitney U-Test is always the same. The null hypothesis states that there is no difference between the data sets being compared.
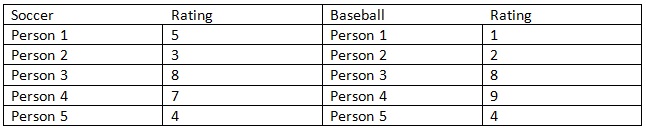
Example: The enjoyment of watching soccer and baseball was rated among 10 randomly selected individuals aged 20 – 25. Each individual was asked to rate how much they enjoyed watching either baseball or soccer, depending upon which group they were in, out of 10. The results are as follows:
In a Mann-Whitney U-Test, the data must be ranked. A rank of 1 is given to the lowest rating between the two groups and if there is a tie for a rank between two ratings, that rank and the subsequent rank get averaged. After this is completed, the ranks for each group are tallied. T1 will represent the ranking for soccer and T2 will be the tally for baseball.
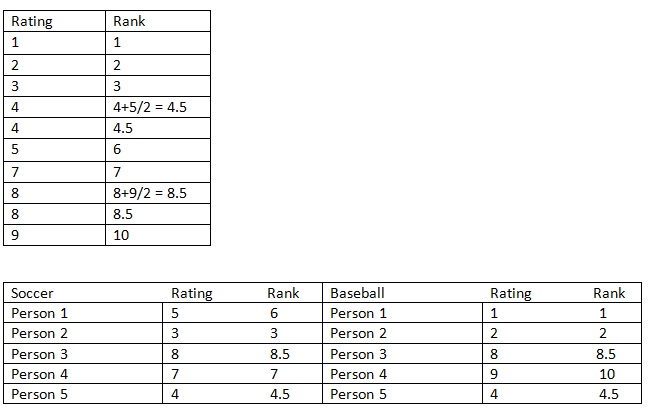
The ranks are added up to get the values for T1 and T2 (T1 = 29 and T2 = 26). Then this formula is utilized:
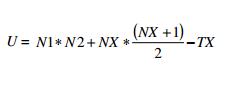
Variables:
TX = the larger rank total (the larger rank total of T1 and T2 is used)
N1 = number of people in T1
N2 = number of people in T2
NX = number of people in the larger rank
Then depending on which significance level is being used, a table giving the critical U values for different sample sizes needs to be used to see whether the derived U value is less or more than is expected at those sample sizes. The null hypothesis is rejected if the U value computed is greater than expected because statistically it is not significant.
© BrainMass Inc. brainmass.com June 27, 2026, 7:04 pm ad1c9bdddf