Explore BrainMass

Explore BrainMass

    Nonparametric Tests

    Contrary to parametric tests, nonparametric tests do not make assumptions about the parameters of the probability distribution and are considered to be distribution-free tests. Nonparametric tests are less sensitive and should not be used in place of parametric tests if the data sets do uphold the conditions required for parametric tests. Parametric tests yield more accurate results.

    As with parametric tests, nonparametric tests have the same overall objectives of estimating population parameters and testing hypotheses. However, nonparametric tests are less powerful compared to parametric tests. Parametric tests are more likely to reject a null hypothesis which is false, rather than conform to making an error. Therefore, nonparametric tests should only be used when the assumptions for parametric tests are violated.  

    Nonparametric tests can be used for interval or ratio data sets, as is the requirement for parametric tests. However, often these tests use ranked data, ordinal data, or nominal data, values measured as frequency counts. Furthermore, unlike parametric tests, outliers do not negatively influence the data since the variance values of the populations do not need to be equal.

    Additionally, nonparametric tests compare median values and not mean values. Since parametric tests require the data to be normally distributed, the mean and median values are equal. This is not the case for data used in nonparametric tests and this is also why outliers do not impede upon the use of nonparametric tests.

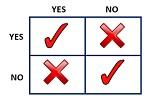
    Nonparametric tests are very effective to use especially when a researcher does not know if their data set is normally distributed. There are nonparametric tests which can be used in place of parametric tests when a researcher wants to know whether a relationship exists between data sets or whether there is a difference between two or more data sets. Some examples of nonparametric tests include the Mann-Whitney U test and the McNemar’s test. 


    References: 

    Image Credit: Wikimedia Commons 

    © BrainMass Inc. brainmass.com March 18, 2024, 6:10 pm ad1c9bdddf

    BrainMass Categories within Nonparametric Tests

    Chi-Squared Test

    Solutions: 719

    The Chi-Squared Test is a nonparametric test that uses the chi-squared statistic to test the goodness of fit between an expected frequency distribution and an observed frequency distribution.

    Mann-Whitney U

    Solutions: 23

    The Mann-Whitney U-Test is a nonparametric test which is analogous to the student’s two-sampled t-test.

    Signed-Rank Test

    Solutions: 15

    The signed-rank test is also known as the Wilcoxon signed-rank test which is a nonparametric test, equivalent to the student’s paired t-test, analyzing whether there is a difference between pairs which are not normally distributed.

    Friedman Test

    Solutions: 1

    The Friedman Test is a nonparametric test that examines the differences in the different treatments over many trials.

    Kruskal-Wallis Test

    Solutions: 11

    The Kruskal-Wallis Test is a nonparametric test that examines whether a sample originates from a particular distribution.

    BrainMass Solutions Available for Instant Download

    Non-Parametric Tests and Research Questions

    Develop a research question for each of the following non-parametric tests: 1. McNemar test for significance of changes 2. Fisher's exact test 3. Chi-square one-sample test 4. Kolmogorov-Smirnov test 5. The sign test, or median test 6. Mann-Whitney U test 7. Wilcoxon rank test 8. Kruskal-Wallis one-way analysis of varian

    General Process of Hypothesis Testing in Statistics

    What is hypothesis testing? Explain the general process and the steps included in conducting a hypothesis test? What is the difference between parametric and nonparametric hypothesis testing? I'm looking for 3-4 paragraphs explaining these questions. If you can include one or two cited references, that would be helpf

    Non-parametric Hypothesis Test

    What hypothesis test can be used to compare weight change during the control period vs. weight change during the lack-of-consistency period? Report a two-tailed p-value.

    Nonparametric Statistics

    Need help for the following: (1) Airline Fares. Listed below are the costs of flights from New York to San Francisco for US Air, Continental, Delta, United, American, Alaska, and Northwest. Use a 0.05 significance level to test the claim that there is no difference in cost between flights scheduled one day in advance and thos

    Kruskal-Wallis Test

    I need assistance in understanding how to work statistics problems. Please review the attachments for data sets. I need step by step details using Kruskal-Wallis Test and how work was done in words of interpretation (that helps explain the results and what it represents) and in EXCEL so that I can understand these types of

    Differences between parametric dependent and independent samples

    What are differences between parametric dependent and independent samples? My facilitator has been known to describe a scenario with two objects and an associated measurement versus another scenario with one object and two associated measurements in his on ground classes. Which is which? Provide concrete examples of each. The

    Which statistical procedure would be used for the 8 problems?

    Which procedure would be appropriate for each situation? Use these for (1-4) one way chi-square two way chi square ANOVA t-test independent samples 1. A researcher is interested in the influence of temperature on helping behavior. She prepares a 'waiting room' for the test subjects. After 15 minutes in the room t

    Non-parametric test, parametric alternative, counterparts

    1. What are the most common reasons you would select a non-parametric test over the parametric alternative? 2. Discuss the issue of statistical power in non-parametric tests (as compared to their parametric counterparts). Which type tends to be more powerful? Why? 3. For each of the following parametric tests, identify t

    Discuss a scenario using non parametric statistics

    1. Give a scenario that would require you to use a non-parametric statistic, such as ranking. 2. Also choose any statistician and find an interesting fact about them. Please provide an answer of good quality, length and merit.

    Describe a Real-Life Situation for Hypothesis Test for Two Variances

    1. Describe a 5-step hypothesis test for two variances for a particular claim related to your work or life environment. You need to state the claim, define the null and alternate hypothesis, identify the test significance and the test statistic, and state the decision rule that will be used. The decision rule may be based on c

    Statistics: Nonparametric test; Kruskal-Wallis test

    Please see attachment. Briefly describe: a. The conditions under which we would use nonparametric tests; b. When a Kruskal-Wallis test is used; and c. The results of the nonparametric test (use APA style)

    Hypothesis Test

    Use the ratio or interval numerical data from one of the data sets available through the Data Sets link on your student website. Develop one research question from which you will formulate a research hypothesis. " Price of property is greater closer to the city" Distance Vs Price Prepare a 1,050- to 1,750-word paper de

    Hypotheis Test on Real Estate Data

    Perform a five-step hypothesis test: H0: The average price of a large home a(bove two-thousand square feet) is equal to the average price of a small home (below two-thousand square feet). H1: The larger the home the higher the price [Please refer to the attachment for the Real Estate Data]. See the attached file.

    Quick Parametric and Nonparametric, Fill in the Blank Exercise

    Parametric and Nonparametric Data Identification Assignment Label each of the following situations "P" if it is an example of parametric data or "NP" if it is an example of nonparametric data. 1. A manufacturer produces a batch of memory chips (RAM) and measures the mean-time-between-failures (MTBF). The manufacturer then

    Nonparametric Hypothesis Testing: Difference in mean price for homes

    See attached files. Using the research question and data in the paper attached, conduct the equivalent, nonparametric test of hypothesis using the 5-step process. The hypothesis is: 'Is there a difference in the mean price per square foot among the homes with different number of rooms'. Formulate a hypothesis state

    Housing the Ultra-Poor - Theory and Practice in Haiti

    The following is an economic case study. Based on your understanding of the ANOVA and utilizing the 5-step plus Hypothesis testing process, determine the F-calculation and the F-critical of the data attached. In addition, write a summary of the inference made based on the acceptance or rejection of your hypothesis statement. P

    Degrees of freedom, Non-parametric tests, Chi-Square, ANOVA

    DQ 1 A recent study of four hundred accidents that occurred on a Saturday night were analyzed. Information collected was the number of vehicles involved and if alcohol played a role in the accident. Role of Alcohol? Number of Vehicles Involved 1 2 3 Totals Yes 50 100 20 170 No 25 175 30 230 Totals 75 275 50 400

    Few questions

    Please give one line reasoning so that I understand them. True or False: 1. The Pearson r is a correlation coefficient appropriate for interval/ratio data. 2. The slope of a line is the change in Y divided by the change in X. 3. The standard error of the estimate is the standard deviation of the errors of predicti

    Nonparametric Hypothesis Test on Real Estate Data

    Research Question: What is the average cost of a home with four bedrooms? Conduct the equivalent, nonparametric test of hypothesis using the five-step process. Prepare a paper describing the results of the nonparametric hypothesis test. Include the following in your paper: - Formulate a hypothesis statement regarding yo

    Hypothesis Test: Choosing the Appropriate Test

    1. When to use a t-test and when to use a z-test for one-sample analysis? Give Example. 2. When to use a t-test and when to use a z-test for two-sample analysis? Give Example. 3 When is an independent t-test used as opposed to dependent t-test? Give Example. 4. When is ANOVA used? Which follow up tests are used

    Hypothesis Test

    Three groups of students, 5 in each group, were receiving therapy for severe test anxiety. Group 1 received 5 hours of therapy, group 2 - 10 hours and group 3 - 15 hours. At the end of therapy each subject completed an evaluation of test anxiety (the dependent variable in the study). Did the amount of therapy have an effect on t

    Nonparametric Test (analyzing/interpreting the data)

    Use a nonparametric test (attached) to see whether current salaries for clerical employees differ for the four gender/race groups. Compare results from those from a parametric analysis. Summarize conclusions. Part 1 output NPar Tests Kruskal-Wallis Test Ranks SEX & RACE CLASSIFICATION N Mean Rank CURRENT SALARY WH

    Non-parametric Testing - Data Analysis (interpreting the data)

    Examine the relationship between education and perception of life. Determine whether to reject the null hypothesis that education and perception of life are independent. Summarize my findings. Below is the problem; and attached is the output and bar chart. Examine the relationship between education and perception of life. C