Explore BrainMass

Explore BrainMass

    Control Chart

    A control chart is used to measure the statistical control associated with manufacturing processes and thus, plots the lower and upper control limits to measure deviations from the controlled state. Control charts are particularly effective for graphing manufacturing processes since these practices are rarely free from variation and are not usually in a state of statistical control. To be in a state of statistical control means that assignable variation, which results from factors such as poorly trained operators or faulty machines to name a couple, is eliminated (1). In the manufacturing industry, there are always various factors at play and control charts represent a way of detecting factors which cause a severe deviation from statistical control.

    A control chart is comprised of a few specific features. For one, it always has a line plotted for the average, which is called the central line. The average being plotted in a control chart is the expected average that the process should be functioning at or the average quality of the process. These charts also always have an upper control limit line and lower control limit line drawn in around the central line and these lines are based both from chance and historical data.

    For control charts to be effective, samples should be taken at a certain interval over time and this new data should be frequently plotted. This ensures that the control associated with a manufacturing process can be monitored. Furthermore, it is important to note that there are two types of control charts: control charts for measurements and control charts for attributes (1). The type of chart used depends on whether the data being plotted is counted, such as the number of faulty products in a sample, or measured.
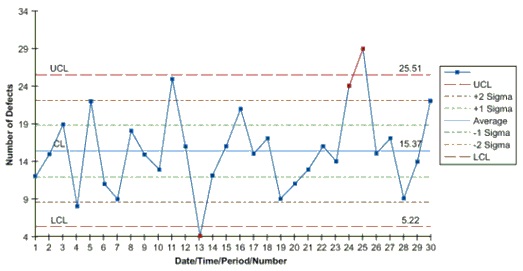
    Figure 1. This figure has been taken from: http://www.isixsigma.com/tools-templates/control-charts/a-guide-to-control-charts/. The central line is in light blue. The lower and upper limit lines are represented by the dashed red lines.

    The above figure, Figure 1¸ provides an example of a control chart for attributes since the observations being measured are counts. Control charts are very effective charts to use in the manufacturing industry and can assist in trying to maintain statistical control in the manufacturing process.

    References:
    1. Miller, I and Freund, J. (2011). Probability and Statistics for Engineers – 8th Edition. Pearson Education, Inc.: U.S.A.
    2. http://www.isixsigma.com/tools-templates/control-charts/a-guide-to-control-charts/

    © BrainMass Inc. brainmass.com April 24, 2024, 8:52 am ad1c9bdddf

    BrainMass Solutions Available for Instant Download

    Control charts

    4) The Canine Gourmet Company produces delicious dog treats for canines with discriminating tastes. Management wants the box-filling line to be set so that the process average weight per packet is 45 grams. To make sure that the process is in control, an inspector at the end of the filling line periodically selects a random box

    Phase 1- Managing the Springville Herald

    Scenario: An advertising production team is charged with reducing the number and dollar amount of the advertising errors, with initial focus on the ran-in-error category. The team collects data, including the number of ads with errors, on a Monday-to-Saturday basis. The attached Excel File SH14-1 (attached) includes a table for

    Statistical Quality Control- Kitty Products Example

    Kitty Products caters to the growing market for cat supplies, with a full line of products, ranging from litter to toys to flea powder. One of its newer products, a tube of fluid that prevents hair balls in long-haired cats, is produced by an automated machine that is set to fill each tube with 63.5 grams of paste. To keep

    How to Construct a Control Chart

    The "defects" column provides the number of defective items found in a sample of 25 for each day. Construct a control chart for the proportion of defective items. Is the process in control? See attachment for data.

    Lower control chart limit

    To guarantee that cans of soda are properly filled, some cans are sampled and the amounts measured. The overall average for the samples is 12 ounces. Each sample contains 10 cans. The average range is 0.4 ounces. The lower control chart limit for the average would be A. 12.1232. B. 11.8768. C. 13.2. D. 12.308. E. n

    Control P-Charts

    I need to show P-Charts for two problems. This informatioin is attached. Thanks.

    Control Charts

    See the data file attached. Researchers at Miami University in Oxford, Ohio, investigated the use of p charts to monitor the market share of a product and to document the effectiveness of marketing promotions. Markt share is defined as the company's proportion of the total number of products sold in a category. If a p-chart

    Control Charts

    The manufacturer of Boston and Vermont asphalt shingles constructed control charts and analyzed several quality characteristics. One characteristic of interest is the strength of the sealant on the shingle. During each day of production, three shingles are tested for their sealant strength. (This, a subgroup is operationally def

    Statistics: Construct a P Chart

    See attached data file. A professional basketball player has embarked on a program to study his ability to shoot foul shots. On each day in which a game is not scheduled, he intends to shoot 100 foul shots. He maintains records over a period of 40 days of practice, with the results stored on the worksheet. a) Construct a

    Control Charts

    See attached data file. A branch manager of a brokerage company is concerned with the number of undesirable trades made by her sales staff. A trade is considered undesirable if there is an error on the trade ticket. Trades with errors are concealed and resubmitted. The cost of correcting errors is billed to the brokerage c

    Control chart analysis and periodic trends

    Please see attached Excel data file. Use a control chart to analyze these data. If these expenditures are not in control, what are the assignable causes? Are there any periodic trends in data (weekday versus weekend)?

    Statistics 5.2: Control chart for Kane on concentricity of engine oil seal groove

    Kane (1986) discusses the concentricity of an engine oil seal groove. Concentricity measures the cross-sectional coaxial relationship of two cylindrical features. In this case, he studied the conccntricity of an oil seal groove and a base cylinder in the interior of the groove. I-le measures the concentricity as a positive dev

    Quantitative anlaysis: Control limits for bad sectors on diskettes

    A computer diskette manufacturer is concerned that some diskettes have bad sectors that would cause a diskette to hold less information than it was intended to hold. In the past, only 5% of these diskettes have bad sectors. If the company wishes to set 99.7% control limits based on samples of size 500, what would these limits be

    Control charts in the manufacturing process

    In a manufacturing process, if the limits for a control chart are set too ________, the risk of unnecessarily tampering with the process __________. Tight, increases Loose, increases Tight, decreases None of the Above

    If a control chart is used correctly

    If a control chart is used correctly, and the necessary corrective actions are taken, as the control limits get _________, the potential quality of the product __________. (Looser, increases/ Tighter, decreases/ Tighter, increases/ or None of the above)

    P chart - Is the process out of control?

    A p-chart has been developed for a particular item. In the past, 3% of such items have been found to be defective. If a sample of 100 is taken, and 9 of these are found to be defective, should the process be considered out of control? Explain

    Control chart-p chart.

    We have taken 12 samples of 400 letters each from a typing pool and found the following proportions of defective letters: 01, .02, .02, .00, .01, .03, .02, .01, .00, .04, .03 and .02. A letter is considered defective when one or more errors are detected. Questions: 1. Calculate the center line, upper and lower control limi

    P-chart example

    A p-chart has been developed for a particular item. In the past, 3% of such items have been found to be defective. If a sample of 100 is taken, and 9 of these are found to be defective, should the process be considered out of control? Explain

    Customer Service Times; Traffic light systems; Processing insurance applications

    Service Time, Sec. Establishing quality control charts for customer servicing times. a. Determine upper and lower control limits for... b. Olivia joined after the chart was established. The following samples of her customer service times... Insurance company considering if retraining is required of salepeople for processi

    Excel Generated Control Chart

    Colonel Electric is a large company that produces lightbulbs and other electrical products. One particular lightbulb is supposed to have an average life of about 1,000 hours before it burns out. Periodically the company will test 5 of these and measure the average time before these burn out. The following table gives the results

    Awake Coffee Company Statistical Quality Control: R-chart and Xbar-chart

    The Awake Coffee Company produces gourmet instant coffee. The company wants to be sure that the average fill of coffee containers is 12.0 ounces. To make sure the process is in control, a worker periodically selects at random a box of six containers of coffee and measures their weight. When the process is in control, the range o

    Control Chart

    Please create a control chart based on the given information: The upper and lower control limits of the data are 3.66 and 1.8 respectively. ** Please see the attached file for the data and diagram **

    (1) What are the center line and control limits for an x chart for this process? (2) Construct a separate x chart for each of the three data sets. Identify any points that are beyond the control limits.

    A) A pharmaceutical manufacturer forms tablets by compressing a granular material that contains the active ingredient and various fillers. The hardness of a sample from each lot of tablets is measured in order to control the compression process. The process has been operating in control with mean at the target value = 11.5 kilo

    Statistics - LCL, UCL

    Assume that 25 samples of 50 each ( 50 per sample) are taken and the total number of defectives is 34. a] Calculate - p b] Find the LCL and UCL for the p-chart. Please show me all of your work

    Statistical Quality Control- Proportion Chart

    The following data shows the packages collected for delivery for ten days and the proportion of packages received not delivered to the customers at the expected time. Day Collected Packages Not delivered Proportion 1 136 4 2 153 6 3 127 2 4 157