Explore BrainMass

Explore BrainMass

    Velocity-Time Graphs

    A velocity time graph is used to graph the speed of the object. It can show acceleration or constant velocity. Time is on the x-axis and velocity is on the y-axis. There are two basic shapes for the velocity time graph that either represent constant velocity motion or accelerated motion. The principle if that the slope of the line on a velocity time graph reveals useful information about the acceleration of the object. If the acceleration is zero, then the slope of the graph is zero. If the acceleration is positive then the slope is positive and if the acceleration is negative then the acceleration is negative. 

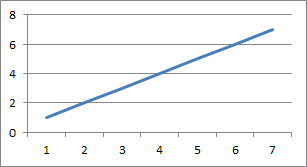
    An example of a velocity time graph with constant acceleration can be seen below.

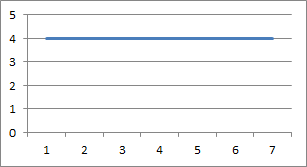
    An example of a velocity time graph with constant velocity can be seen below.

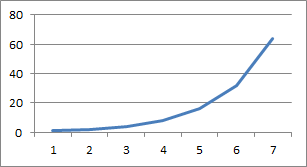
    An example of a velocity time graph where the object is accelerating.

    © BrainMass Inc. brainmass.com March 19, 2024, 2:56 am ad1c9bdddf

    BrainMass Solutions Available for Instant Download

    Velocity Questions

    Two cars travel in the same direction along a straight highway, one at a constant speed of 55.0 mi/h and the other at 70.0 mi/h. Assume the cars start at the same point and arrive at the same destination which is 10.0 miles away. a. Sketch a position vs. time graph. On this graph put both car 1 (55.0 mi/h) and car 2 (70.0 mi/h)

    Particle moves along the x-axis

    1. A particle moves along the x-axis. Its position varies with time and is given by equation x =-6t + 3t^2 where x is in metres and t is in seconds. a) Sketch the position time graph for the particle between 0s and 4s. b) What is the displacement of the particle after the first second? c) What is the average velocity of the p

    Problems with a Damped Harmonic Oscillator

    (A) A damped oscillator is described by the equation: m [(x)ddot] = ?b [(x)dot] ? kx What is the condition for critical damping? Assume this condition is satisfied. (B) For t < 0 the mass is at rest at x = 0. The mass is set in motion by a sharp impulsive force at t = 0, so that the velocity is v0 at time t = 0

    Physical Dynamics

    Can you please do these questions and show all work? * Please see the attached file for the complete problem description **

    Velocity-Time Graph Example Questions

    This graph is for understanding the concepts of variable velocity, uniform velocity, uniform acceleration, negative acceleration, displacement and average velocity of a body moving along a straight line. Answer the following questions: a. What is the velocity of the car at 2, 8, 16 and 20 s? b. What is the acceleration of t

    Understanding Velocity-time Graphs and their Interpretation

    This question will strengthen your concepts of linear motion. A graph showing variation of velocity of a car moving along a straight line is given. You are required to find acceleration of the car at different moments of time and its displacement.

    Various Quadratic Equation Problems

    See the attached file. 1. Use discriminant to determine whether the following equations have solutions that are: two different rational solutions; two different irrational solutions; exactly one rational solution; or two different imaginary solutions. x^2 - 12x + 34 = 0 2. Use the quadratic formula to determine the x-interc

    Impulse Calculation For Tennis Ball Collision

    Suppose the force acting on a tennis ball (mass 0.065 kg) points in the +x direction and is given by the graph of Fig. 7-30 as a function of time. Figure 7-30 in attached document. (a) Use a graphical method to estimate the total impulse given the ball. N·s (b) Use a graphical method to estimate the velocity of the ba

    Position and Velocity

    Need help with this problem on position and velocity. I'm given a graph of velocity vs. time, how do I draw the acceleration vs. time from these graph?(question 2) And then I am given acceleration vs. time and need to draw velocity vs. time from these graph (question 3). Please see attachment.

    Motion, force, work

    Please assist with the following questions. 1. In Physics the "desire of an object to keep doing what it is doing" is termed ________. 2. The phrase "ten meters per second squared" described the ____________. 3. Your light truck weighs 3,500 kg. You drive up a gentle slope that is 0.5 km long. At the top of the slope

    Velocity and Area under the Curve

    Please see the attached file for the fully formatted problems. • Use elementary geometry to find the area under the graph of between and . Sketch a picture. • The velocity of an object is sketched below. Estimate the total distance travelled by an object between and .

    25 Multiple Choice question all mechanics, Fully explained

    1. A bicycle travels 141 m along a circular track of radius 15m. What is the angular displacement in radians of the bicycle from its starting position? a. 1.0 rad b. 1.5 rad c. 3.0 rad d. 4.7 rad e. 9.4 rad 2. What is the angular speed in rad/s of the second hand of a watch? a. 1.7 à? 10-3 rad/s b. 0.10 rad/s c.

    Velocity and Time Graphs

    The Velocity-time graph below shows the motion of a cyclist: (a) Describe in words the motion of the cyclist? (b) Calculate the acceleration of the cyclist from: (i) A to B (ii) B to C (iii) C to D (c) If the cyclist travelled a total distance of 200m, calculate the total time for this motion.

    Acceleration / deceleration physics problem

    A car accelerates at a steady rate from 0 to 108km per hour in 30 seconds, travels at constant speed for one minute, and then brakes at a constant rate to a stop in 10 seconds. Please answer the following questions with full explanations: 1) Draw a velocity-time graph with velocity (vertical axis) in m/s and time (horizont

    A 3.0 kg object subject to a restoring force F...

    2. A 3.0 kg object subject to a restoring force F is undergoing simple harmonic motion with small amplitude. (See attachment) The potential energy U of the object as a function of distance x from its equilibrium position is shown above. This particular object has a total energy E of 0.4 J. (a) What is the object's pote

    Collisions in one dimension - force and impulse

    A rubber ball of mass 0.05kg is dropped from a height of 10 cm above a table top. it bounces off the table and rises to the same height. a. What is the shape of the graph of the force exerted on the ball by the table as a function of time? b. If the rubber ball was in contact with the table for 30ms, what is the avg force

    Calculating height on one dimension

    An arrow is shot with a velocity of 45 m/s at an angle 50 degrees with the horizontal.What is the height of the arrow at a point 150 meters down range? I think I know how to get the TOTAL distance: 45sin(50)(3.52)-.5x9.8x3.52=203.6M BUT NOT THE HEIGHT.

    Graphing Initial Downward Velocity

    Part A: A soap bubble is given an initial velocity downward from a height of H directly above a vent. Warm air from the vent gently applies a small constant upward force on the soap bubble. As a result, the soap bubble descends only to within a few centimeters of the vent before turning around. --For the entire motion of

    Displacement, Velocity and Acceleration Graphs

    Problem 1: The plot show x position vs time of a mass on a spring. Acceleration between t = 2 and 4 sec is positive. Why? From 2 to 3 sec, what is acceleration? From 3 to 4 seconds, what is the acceleration? Problem 2: Position of a car is r(t) = ((v_x)(t-3))i-hat - (r_y)j-hat - (a_z)t^2(k-hat), where v_x = 4,/s. r_y = 1.5m,

    Translating Position, Velocity and Acceleration Graphs

    1. For t = 0,1,2,3,4 and y=0,25,60,105,160 respectively. Plot this position vs time graph. The slope of this position vs time graph is velocity. Draw and explain step by step how you get the velocity graph from this. 2. Is the position graph increasing or decreasing? 3. Draw the acceleration graph and give units or #s

    Slope of acceleration time graph for motion in 1-D.

    If the curve on the position versus time graph is velocity, and the velocity versus time graph curve is acceleration,what is the curve for the acceleration graph versus time? Or am I wrong? If you have a y versus x graph as our teacher said it is not the velocity, then it is y versus x, which is not velocity, then what is it?

    Kinematics and Velocity/Position Graphs

    Given the acceleration graph, and the velocity and position graphs, explain how one obtains the position graph from the velocity graph. The position graph at the bottom is speeding up, then slowing down, but why not back to the 0 on the x axis? Give other examples please, with details and labelled lines, and curves if speeding

    Kinematics and Velocity, Position, and Acceleration

    Please look at the position, velocity, and acceleration graphs. Please explain the position graph, the motion to a car, using the parameter of slope. How were the velocity and acceleration graphs obtained? Give other examples please, using simple explanations with numbers and theory.

    Velocity and Acceleration - Graph

    Please give step by step solutions and answers so I can see how you got the answers and understand it please. The graph on the page is a velocity versus time graph. Time is in seconds. The graph has points at (0,20),(5,40),(10,60),(15,80),(15,60),(15,40),(15,20),(15,0),(15,-20),(15,-40),(20,-40),(25,0),(30,0). The questi

    Solve: Velocity and Vectors

    The page has Graph A, B and C. I hope this works here, but graph A versus time looks like this: The dots are the graph line and the letter a is before the dots so when this is posted the dots won't shift. The a's have nothing to do with the graphs. Graph A. aa. aaaa. aaaaaa. aaaaaaaaaa. aaaaaaaaaaaaaa. aaaaaaaaaaaaaaaa