Explore BrainMass

Explore BrainMass

    Histogram

    A histogram is used in statistics to visually present a frequency distribution for different category boundaries, through the construction and juxtaposition of rectangular bars. Histograms are very frequently used in statistics to visualize data because they provide an effective and simple method for presenting the frequency of particular values for a data set or independent variable. After constructing a frequency distribution, histograms are commonly the subsequent step in presenting the data.

    Histograms are similar in appearance to bar graphs, but unlike bar graphs, there are no spaces between the bars of histograms. Additionally, histograms can be used to represent numerical data that is provided by intervals, which is common when graphing the data from a frequency distribution. Thus, each of the bars can be marked by boundaries.

    Additionally, histograms are also used frequently in statistics to test for normality and inspect whether any irregularities are associated with the data. A test for normality indicates whether or not the data follows a normal distribution. A test for irregularities may analyze whether or not more than one pronounced peak exists within the data set for example.

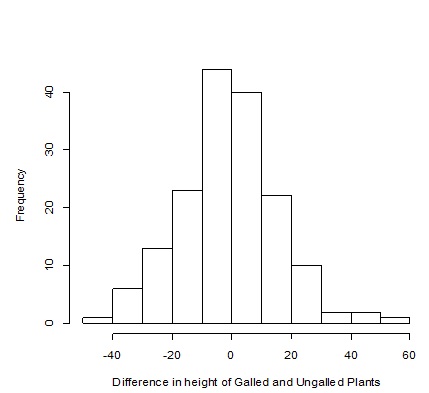
    Figure 1. This is a histogram in which the differences calculated for the height between the galled and ungalled plants is plotted. These differences were calculated by calculating the height difference for the entire sample size (n=164) between the galled and ungalled plants. This histogram is used to test for normality.

    Figure 1 above, presents an example of a histogram being constructed for an ecological situation. As is mentioned in the figure caption, this histogram was used to test for normality. From a quick visual inspection, the pattern of the bars, resembling a bell shaped curve, indicates that the data for the variable being measured follows a normal distribution.

    © BrainMass Inc. brainmass.com April 27, 2024, 6:05 am ad1c9bdddf

    BrainMass Solutions Available for Instant Download

    Descriptive Statistics and Histogram

    Question 2 The U. S. Department of the Interior releases figures on mineral production. The following are the 15 leading states in nonfuel mineral production in the United States in 2008. State Value ($ billions) Arizona 7.84 Nevada 6.48 Florida 4.2 Utah 4.17 California 4 Texas 3.8 Minnesota

    Interpretation of independent t tests (SPSS output)

    I need help with interpretation. I have included the actual data that was used in SPSS statistics as well as the Outputs. I have attached everything that I have below. Can you please help me once again with the interpretation of information?

    Statistical Analysis: Quality of Service

    One of the major measures of the quality of service provided by any organization is the speed with which it responds to customer complaints. A large family-held department store selling furniture and flooring, including carpet, had undergone a major expansion in the past several years. In particular, the flooring department had

    Graphing Relationships

    It's in excel format. i don't know whether to use ANOVA or chi-square test; or to average the names and then run the numbers. I am so confused. I need to show these relationships in graph/pie 1. students (rank) and time spent studying (highest to lowest) 2. students' self rating and the time spent studying 3. students' s

    National Survey of Student Engagement surveys: histogram, distribution

    The National Survey of Student Engagement (NSSE) surveys freshmen and seniors about their level of engagement in campus and classroom activities that enhance learning. Hundreds of thousands of students from over 1,200 schools have completed surveys since 1999, the first year that the NSSE was administered. Among the many quest

    Relative Frequency Histogram

    Question: Graph a relative frequency histogram for the 500 measurements summarized in the accompanying relative frequency table. Measurement Class Relative Frequency .5-2.5 .10 2.5-4.5 .15 4.5-6.5

    Calculation of Percentages

    Repack Solutions, Inc. has a distribution center in Cincinnati where it receives and breaks down bulk orders from suppliers' factories, and ships out products to retail customers. Prepare a chart showing the different quality cost categories and percentages for the company's quality costs that were incurred over the past year. W

    Finding Mean and Construct Frequency Histogram

    How do I find the mean and median for the following: Adair vineyard is a 10 acre vineyard. Since they are small and considering expansion they are curious how their size compares to that of other vineyards. The histogram shows 36 wineries. The size (acres) are broken into 30 acres sections. Please show how: There are

    Ogives, frequency curve , histogram

    1. Consider the following data on distances traveled by 40 people to visit the local amusement park. distance freq 1-8 15 9-16 12 17-24 7 25-32 5 33-40 1 total 40 Expand and construct the table adding columns for relative frequency and cumulative relative frequency. 2. For the above Table (in

    Histogram and relative frequency

    Please help with the following problems. See attached file for proper table format. Accounting Horizons published a 1998 study in which corporate executives reported the number of times each year they held audit committee meetings with the chief internal auditor of the corporation. The raw data are shown below: 0 0 0 0 0

    Ads for ADT Security Systems claim

    1. The Public Health Service studied the effects of smoking on health, in a large sample of representative households. For men and for women in each age group, those who had never smoked were on average somewhat healthier than the current smokers, but the current smokers were on average much healthier than those who had recently

    Histogram, Frequency Polygon & Ogive

    The attached table gives sales figures of Ipods during a Christmas period. Arrange the data into a less than cum frequency distribution using five groups of equal width. Let 20 be the lower limit of the smallest class. Draw to scale each of the following to represent the above data a. Histogram b. Frequency Polygon c.

    Constructing a Histogram in Excel

    The number of weekly sales calls by a sample of 25 pharmaceutical salespersons is below: 25, 55, 45, 35, 37, 27, 29, 44, 34, 28, 33, 28, 46,31, 38, 41, 48, 38, 27, 29, 37, 33, 31, 40, 50 Construct a histogram in Excel and show all the formulas.

    Statistical Analysis

    1. A production manager is interested in determining the variability in the proportion of defective items in a shipment in one of the computer components that her company manufactures. The spreadsheet provided contains the proportion of defective components for each of the 500 randomly selected shipments collected during the one

    Creating a Histogram: CNC Vendor Facility Example

    The following data are from a runoff held at the CNC vendor's facility. The indicated portion of the shaft was chosen for inspection. The diameter specifications for the round shaft are 7.650 + 0.02 mm. In order to prevent scrap for this particular operation, there is no lower specification. The data are scaled from 7.650, that

    Forecast Future Inventory Costs

    Summer Historical Inventory Data Typical Seasonal Demand for Summer Highs Actual Demands (in units) Month Year 1 Year 2 Year 3 Year 4 Forecast 1 18,000 45,100 59,800 35,500 2 19,800 46,530 30,740 51,250 3 15,700 22,100 47,800 34,400 4 53,600 41,350 73,890 68,000 5 83,200 46,000 60,200 68,100 6

    Frequency Table & Histogram

    Following are the speeds of 40 cars clocked by radar on a particular road in a 35-mph zone on a particular afternoon: 30, 36, 42, 36, 30, 52, 36, 34, 36, 33, 30, 32, 35, 32, 37, 34, 36, 31, 35, 20, 24, 46, 23, 31, 32, 45, 34, 37, 28, 40, 34, 38, 40, 52, 31, 33, 15, 27, 36, 40 Make (a) a frequency table and (b) a histog

    Statistics: Compute range, mean, various, deviation, distribution

    Excel: All problem sets and answers must be in Excel. #1: Prepare answers to the following: The annual incomes of five vice-presidents of TRW Inc. are: $125,000, $128,000, $122,000, $133,000, and $142,000. Consider that is the entire population and compute: a. Range, b. The arithmetic mean income and the median income, c

    Histograms for Grouped Data: Length of stay in days in a hospital

    The following are the lengths of stay (in days) for a random sample of patients discharged from a particular hospital: 13, 9, 5, 11, 6, 3, 12, 10, 11, 7, 3, 9, 9, 4, 4, 2, 2 Draw the histogram for these data using an initial class boundary of 1.5 , an ending class boundary of 13.5, and 6 classes of equal width. Note that you

    Histograms: What shape of sample; value of estimate; standard deviation

    A population has a mean of 79 and a standard deviation of 27. Sample means are computed for several thousand random samples of size ? = 81, and a relative frequency histogram is constructed for the sample means. 1. What kind of shape would you expect the histogram of the sample size to have? 2. What value would you es

    Statistical Analysis: Job Satisfaction

    Categorize the given data according to the Scale of Measurement as Nominal, Ordinal, Interval and Ratio. Create one Frequency Distribution, one Cross-Tabulation and one Histogram from the given data. See the attached file.

    Creating a Histogram Given Mean and Standard Deviation

    Create a histogram with a mean of 2.73 and a standard deviation of 0.31 Observation Fabric weight 1 2.78 2 2.46 3 3.00 4 2.80 5 2.71 6 2.61 7 3.12 8 3.02 9 2.94 10 2.44 11 3.06 12 2.90 13 2.74 14 2.57 15 2.06 16 2.32 17 2.62 18 2.41 19 2.43 20 3.44 21 2.69 22 2.36 23 1.92 24 2.00 25 2.63 26 2.75 27

    Variables, Speed, Distributions and Graphs

    Explain and give an example for each of the following types of variables a. equal-interval b. rank-order c. nominal d. ratio scale e. continuous 2. Following are speeds of 40 cars clocked by radar on a particular road in a 35-mph zone on a particular afternoon; 30, 36,42,36,30,52,36,33,30,32,35,32,37,34,36,31,35,20,24,4

    Distribution of Average Low Temperatures in Denver

    The monthly average low temperatures* during different months of year at Denver, CO are given below: January February March April May June 5 8 18 29 40 50 July August September October November December 55 53 44 32 24 12 Source: www.weather.com Word-process your solution and answers below. a) Find the mean year

    Drawing Conclusions for Ambulance Departments

    Between mar, 1, 1994 and aug 31, 1994, all calls that involved both ambulance and fire department personnel were monitored. The times for each service to arrive at the scene were recorded using the following format: Column 1: call number for Cambridge calls Column 2: time in minutes for fire truck to arrive Column 3: time i

    Standard Deviations and Variables

    (a) Find the following for variables A and B: mean, median, mode and standard deviation. (b) Create a histogram for variables A and B and create a scattergram between variables A and B (c) Compute the coefficient correlation between variables A and B Variable A: Variable B:

    Sampling and histograms

    Please help with the following problems involving sampling and histograms. a. A graduate student is conducting research in psychology and she needs to obtain the IQ scores of 50 people. She places an ad in the local newspaper and asks for volunteers, each of whom will BE PAID $50 to take the IQ test. Is her sample a good sam