Explore BrainMass

Explore BrainMass

    PV Diagrams

    A pressure volume diagram is used to describe corresponding changes in volume and pressure in a system. They are commonly used in thermodynamics, cardiovascular physiology and respiratory physiology.

    PV diagrams were originally called indicator diagrams. They were developed in the 18th century as tools for understanding the efficiency of steam engines. It was developed by James Watt and John Southern.

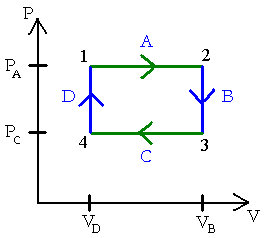
    PV diagrams can be used to estimate the net work performed by a thermodynamic cycle. The net work is the area enclosed by the PV curve in the diagram. This usage derived from the development of indicator diagrams which were used to estimate the performance of a steam engine. The diagram records the pressure of steam versus the volume of steam in a cylinder throughout a piston’s cycle of motion in a steam engine.

    On a pressure volume diagram, the volume is on the x-axis and the pressure is on the y-axis. 

    © BrainMass Inc. brainmass.com April 24, 2024, 1:32 pm ad1c9bdddf

    BrainMass Solutions Available for Instant Download

    calcuation of heat and work in the piston-cylinder problem

    Please show all the work. A piston-cylinder device whose piston is resting on a set of stops initially contains 3 kg of air at 2 bar and 27 degree Centigrades. The mass of the piston is such that a pressure of 4 bar is required to move it. Heat is now transferred to the air until the volume doubles. Determine the work done by

    Thermodynamic process

    See attached diagram. 1. The figure shows a thermodynamic process followed by 150mg of helium. a) Determine the pressure (in atm) of the gas at points 1, 2, and 3. p1,p2,p3=________atm b) Determine the temperature (in celsius) of the gas at points 1, 2, and 3. T1,T2,T3=________ celsius c) Determine the volume

    Thermodynamics Example Problems

    1 mole of a perfect gas for which Cv = 3R/2, independent of temp., is taken from a temp of 100 K and pressure of 10^5 Pa to 400 K and 8*10^5 Pa by two different paths. 1. It goes at constant volume from 100 K to 400 K and then isothermally to the final pressure. 2. It goes at constant pressure from 100 K to 400 K an

    PV-Diagram and Ideal Gas

    Four moles of O2 are taken from A to B in the process shown in the PV-diagram below. Assume the gas may be treated as ideal. a) What is the heat flow during this process (include the sign)? b) Does heat enter or leave the gas?

    Ideal Gas Model, Quasi-Static Processes

    The Bermuda Triangle (see attachment) A cylinder with initial volume V contains a sample of gas at pressure p. The gas is heated in such a way that its pressure is directly proportional to its volume. After the gas reaches the volume 3V and pressure 3p, it is cooled isobarically to its original volume V. The gas is then coole

    Ideal Gas Model Question, Quasi-Static Question

    The Bermuda Triangle (see attachment) A cylinder with initial volume V contains a sample of gas at pressure p. The gas is heated in such a way that its pressure is directly proportional to its volume. After the gas reaches the volume 3V and pressure 3p, it is cooled isobarically to its original volume V. The gas is then coole