Acceleration-time graph has time on the x-axis and acceleration on the y-axis. The area under the between the curve and the x-axis is the distance traveled by the object in motion. When the slope of the line is zero, the acceleration of the object is constant. When the slope of the line is positive, the acceleration is speeding up in a positive direction. When the slope of the line is negative, the object is decelerating. An acceleration time graph is particularly useful when trying to find the total distance traveled by the object.
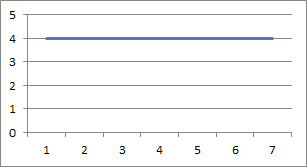
An example of an acceleration-time graph with constant acceleration over time.
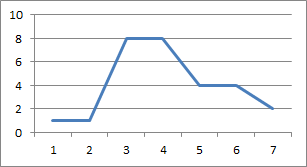
An example of an acceleration-time graph with changing accelerations over time.
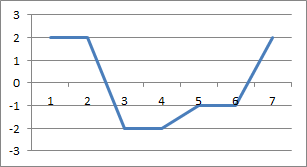
An example of an acceleration-time graph with positive and negative accelerations.