Graphs are a representation of a set of data where pairs of data are connects by links. It is an area of mathematics and computer science combining methods from geometric graph theory and information visualization to derive two-dimensional depictions of graphs. It is a pictorial representation of the vertices and edges of a graph.
Graphs measure many different qualities in an attempt to find objective means of evaluation their aesthetics and usability. The crossing number of a drawing is the number of pairs of edges that cross each other. If the graph is planar, it is often convenient to draw it without any edge intersections. The area of a drawing is the size of its smallest bounding box, relative to the closest distance between any two vertices. Symmetry display is the problem of finding symmetry groups within a given graph, and finding a drawing that displays as much of the symmetry as possible. The slope number of a graph is the minimum number of distinct edge slopes needed in a drawing with straight line segment edges.
There are many different types of graphs; there are simple bar graphs to more complex box and whisker plots. Drawing graphs with an x- and y-axis requires an independent and dependant variable. The dependant variable goes on the y-axis and the independent variable goes on the x-axis, such as time and distance. It is important to maintain the same scale throughout the graph.
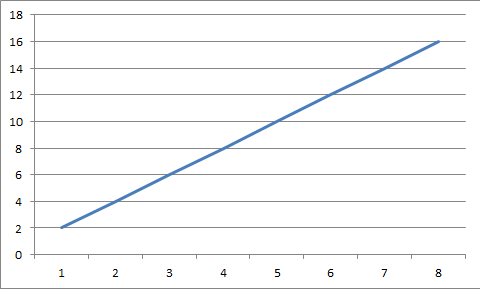
Line Graph
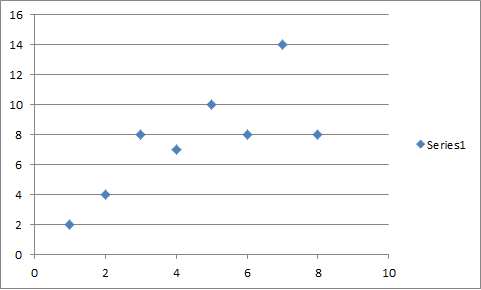
Scatter Plot
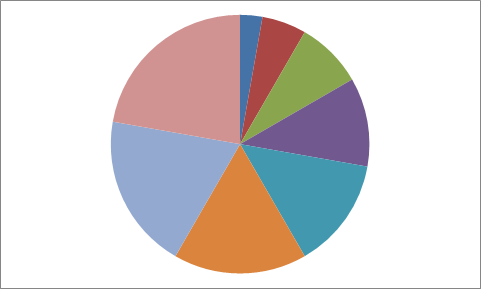
Pie Chart
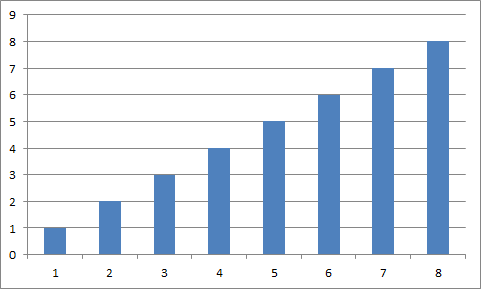
Bar Graph
© BrainMass Inc. brainmass.com July 9, 2026, 8:43 am ad1c9bdddf