Population growth and transitions
Not what you're looking for?
Juveniles Adults
Subpopulation size (aged under 15 years) (aged 15 years and over)
(in millions) 1.89 5.31
Birth rate 0 0.0332
Death rate 0.0086 0.0295
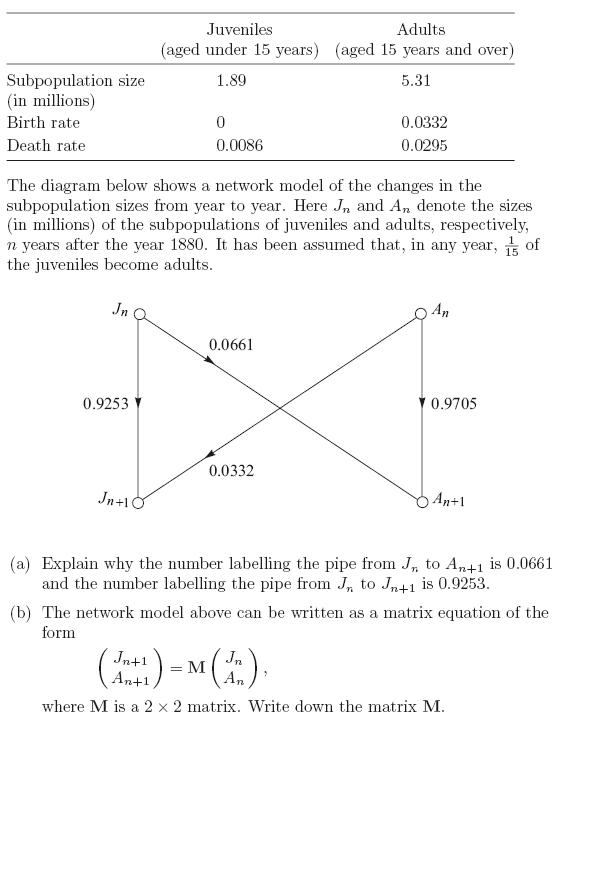
The diagram below shows a network model of the changes in the subpopulation sizes from year to year. Here Jn and An denote the sizes (in millions) of the subpopulations of juveniles and adults, respectively, n years after the year 1880. It has been assumed that, in any year, 1/15 of the juveniles become adults.
[DIAGRAM]
(a) Explain why the number labeling the pipe from J to An+1 is 0.0661 and the number labeling the pipe from Jn to Jn+1 is 0.9253.
(h) The network model above can be written as a matrix equation of the form
....
where M is a 2 x 2 matrix. Write down the matrix M.
Purchase this Solution
Solution Summary
The solution shows how to convert the network diagram to a matrix-based system.
Solution Preview
Hello and thank you for posting your question to Brainmass!
The solution is attached below in two files. ...
Purchase this Solution
Free BrainMass Quizzes
Multiplying Complex Numbers
This is a short quiz to check your understanding of multiplication of complex numbers in rectangular form.
Geometry - Real Life Application Problems
Understanding of how geometry applies to in real-world contexts
Know Your Linear Equations
Each question is a choice-summary multiple choice question that will present you with a linear equation and then make 4 statements about that equation. You must determine which of the 4 statements are true (if any) in regards to the equation.
Graphs and Functions
This quiz helps you easily identify a function and test your understanding of ranges, domains , function inverses and transformations.
Exponential Expressions
In this quiz, you will have a chance to practice basic terminology of exponential expressions and how to evaluate them.