Biochemical and behavioural Pharmacology
Not what you're looking for?
Hi, I have attached 2 calculations file. Using those calcuations, I am supposed to draw a log graph, However, I am totally clueless as to how I am supposed to proceed with it in regards to obtaining curves etc.
Therefore, If somebody could start me off and give me an indiaction or explanation as to how I am supposed to draw the graph, I would be grateful.
Thanks
PS I know there is no log graph attached but if somebody could maybe draw a sample on word or other application it would be great.
Purchase this Solution
Solution Summary
Biochemical and behavioural pharmacology is discussed. The process in regards to obtaining curves is determined.
Solution Preview
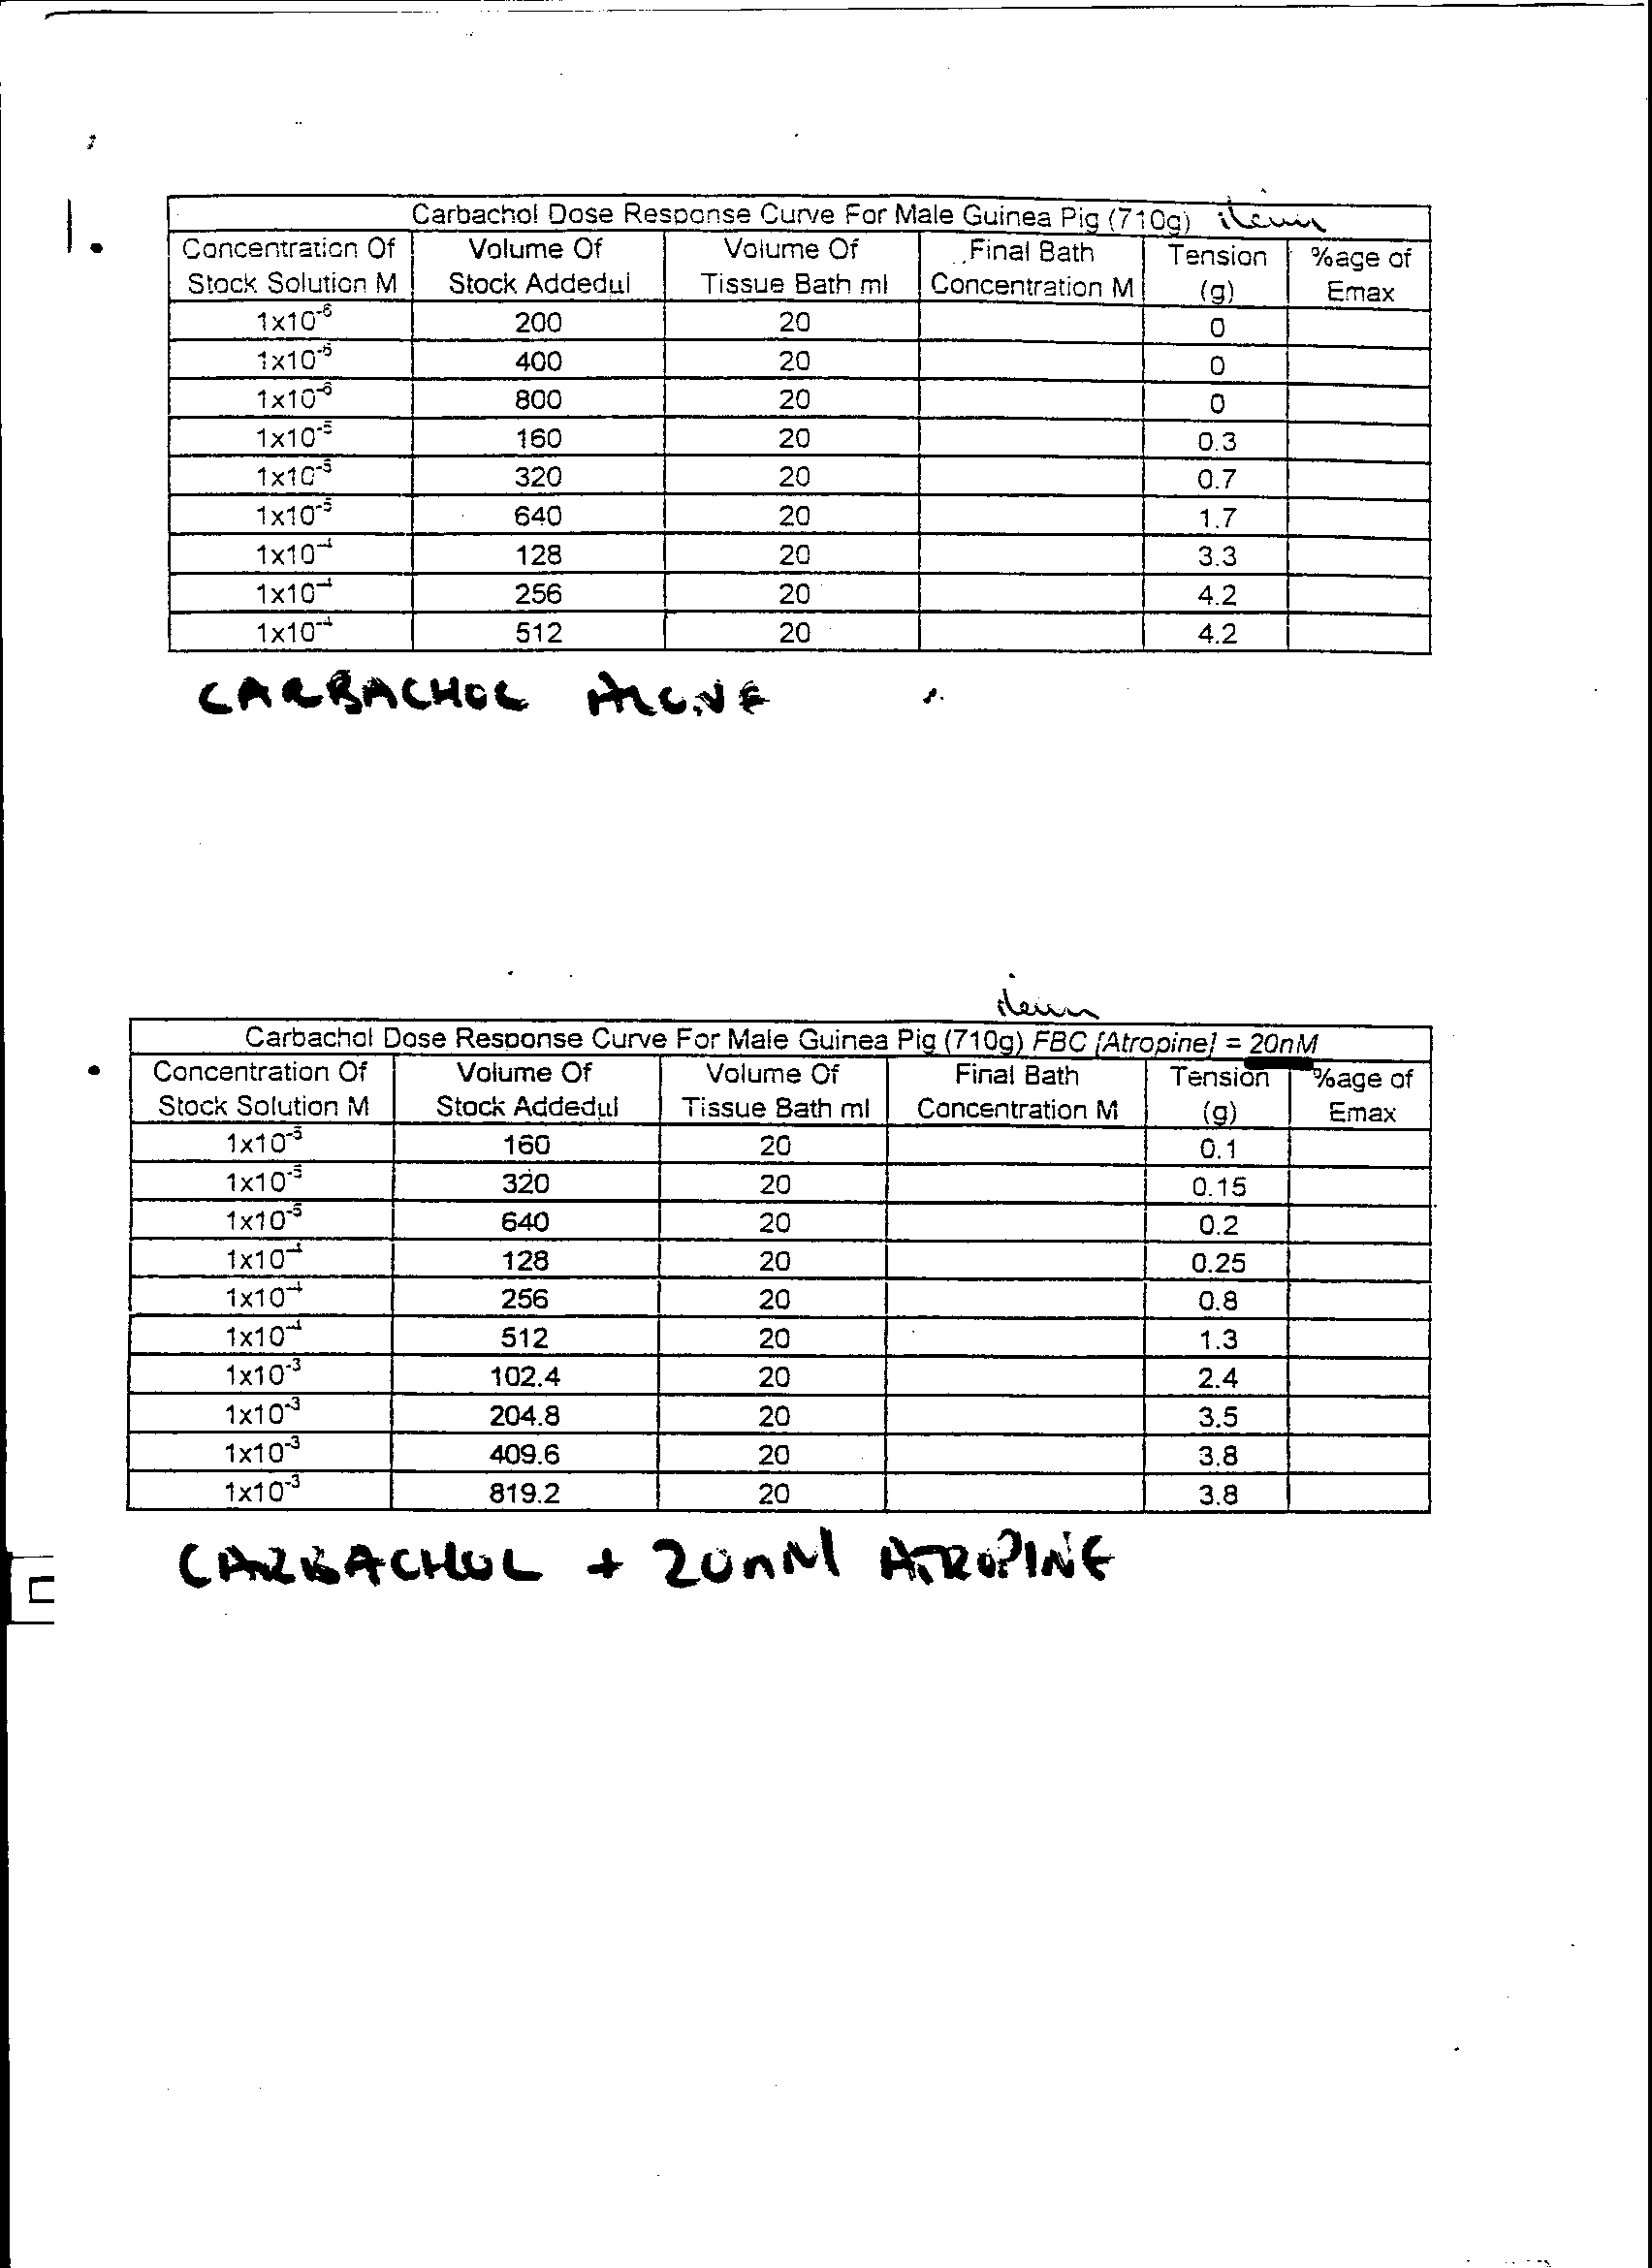
As a sample explanation, I drew the graph corresponding to the second table on "Calculations.jpg." This is the table that has handwritten underneath it, "Carbachol + 20 nM Atropine." You should be able to do the rest of the data yourself by examining the details below as well as in the attached Excel file.
______________________________________
1. Transfer the data into Excel by typing the concentration of stock solution into ...
Purchase this Solution
Free BrainMass Quizzes
Basic Immunology Quiz
Intro to immuno quiz. Covers the basics of immunology and recognition of foreign substances by the body.
Cellular Respiration
This quiz is a review for cellular respiration.
Identifying Variables in Science Experiments, Part 2
Using sample experiments, test yourself to see if you can identify independent, dependent, and controlled variables. Identifying variables is key in understanding and developing experiments. The questions are biology related, but this can be applied to any area of science.
BioChemistry Basics
This Quiz will test your knowledge of the amino acids used in biological systems
Hemophilia: Fact or Fiction
Do you know the truth about hemophilia? Test your knowledge here.