Determine sample size from Control Chart values
Not what you're looking for?
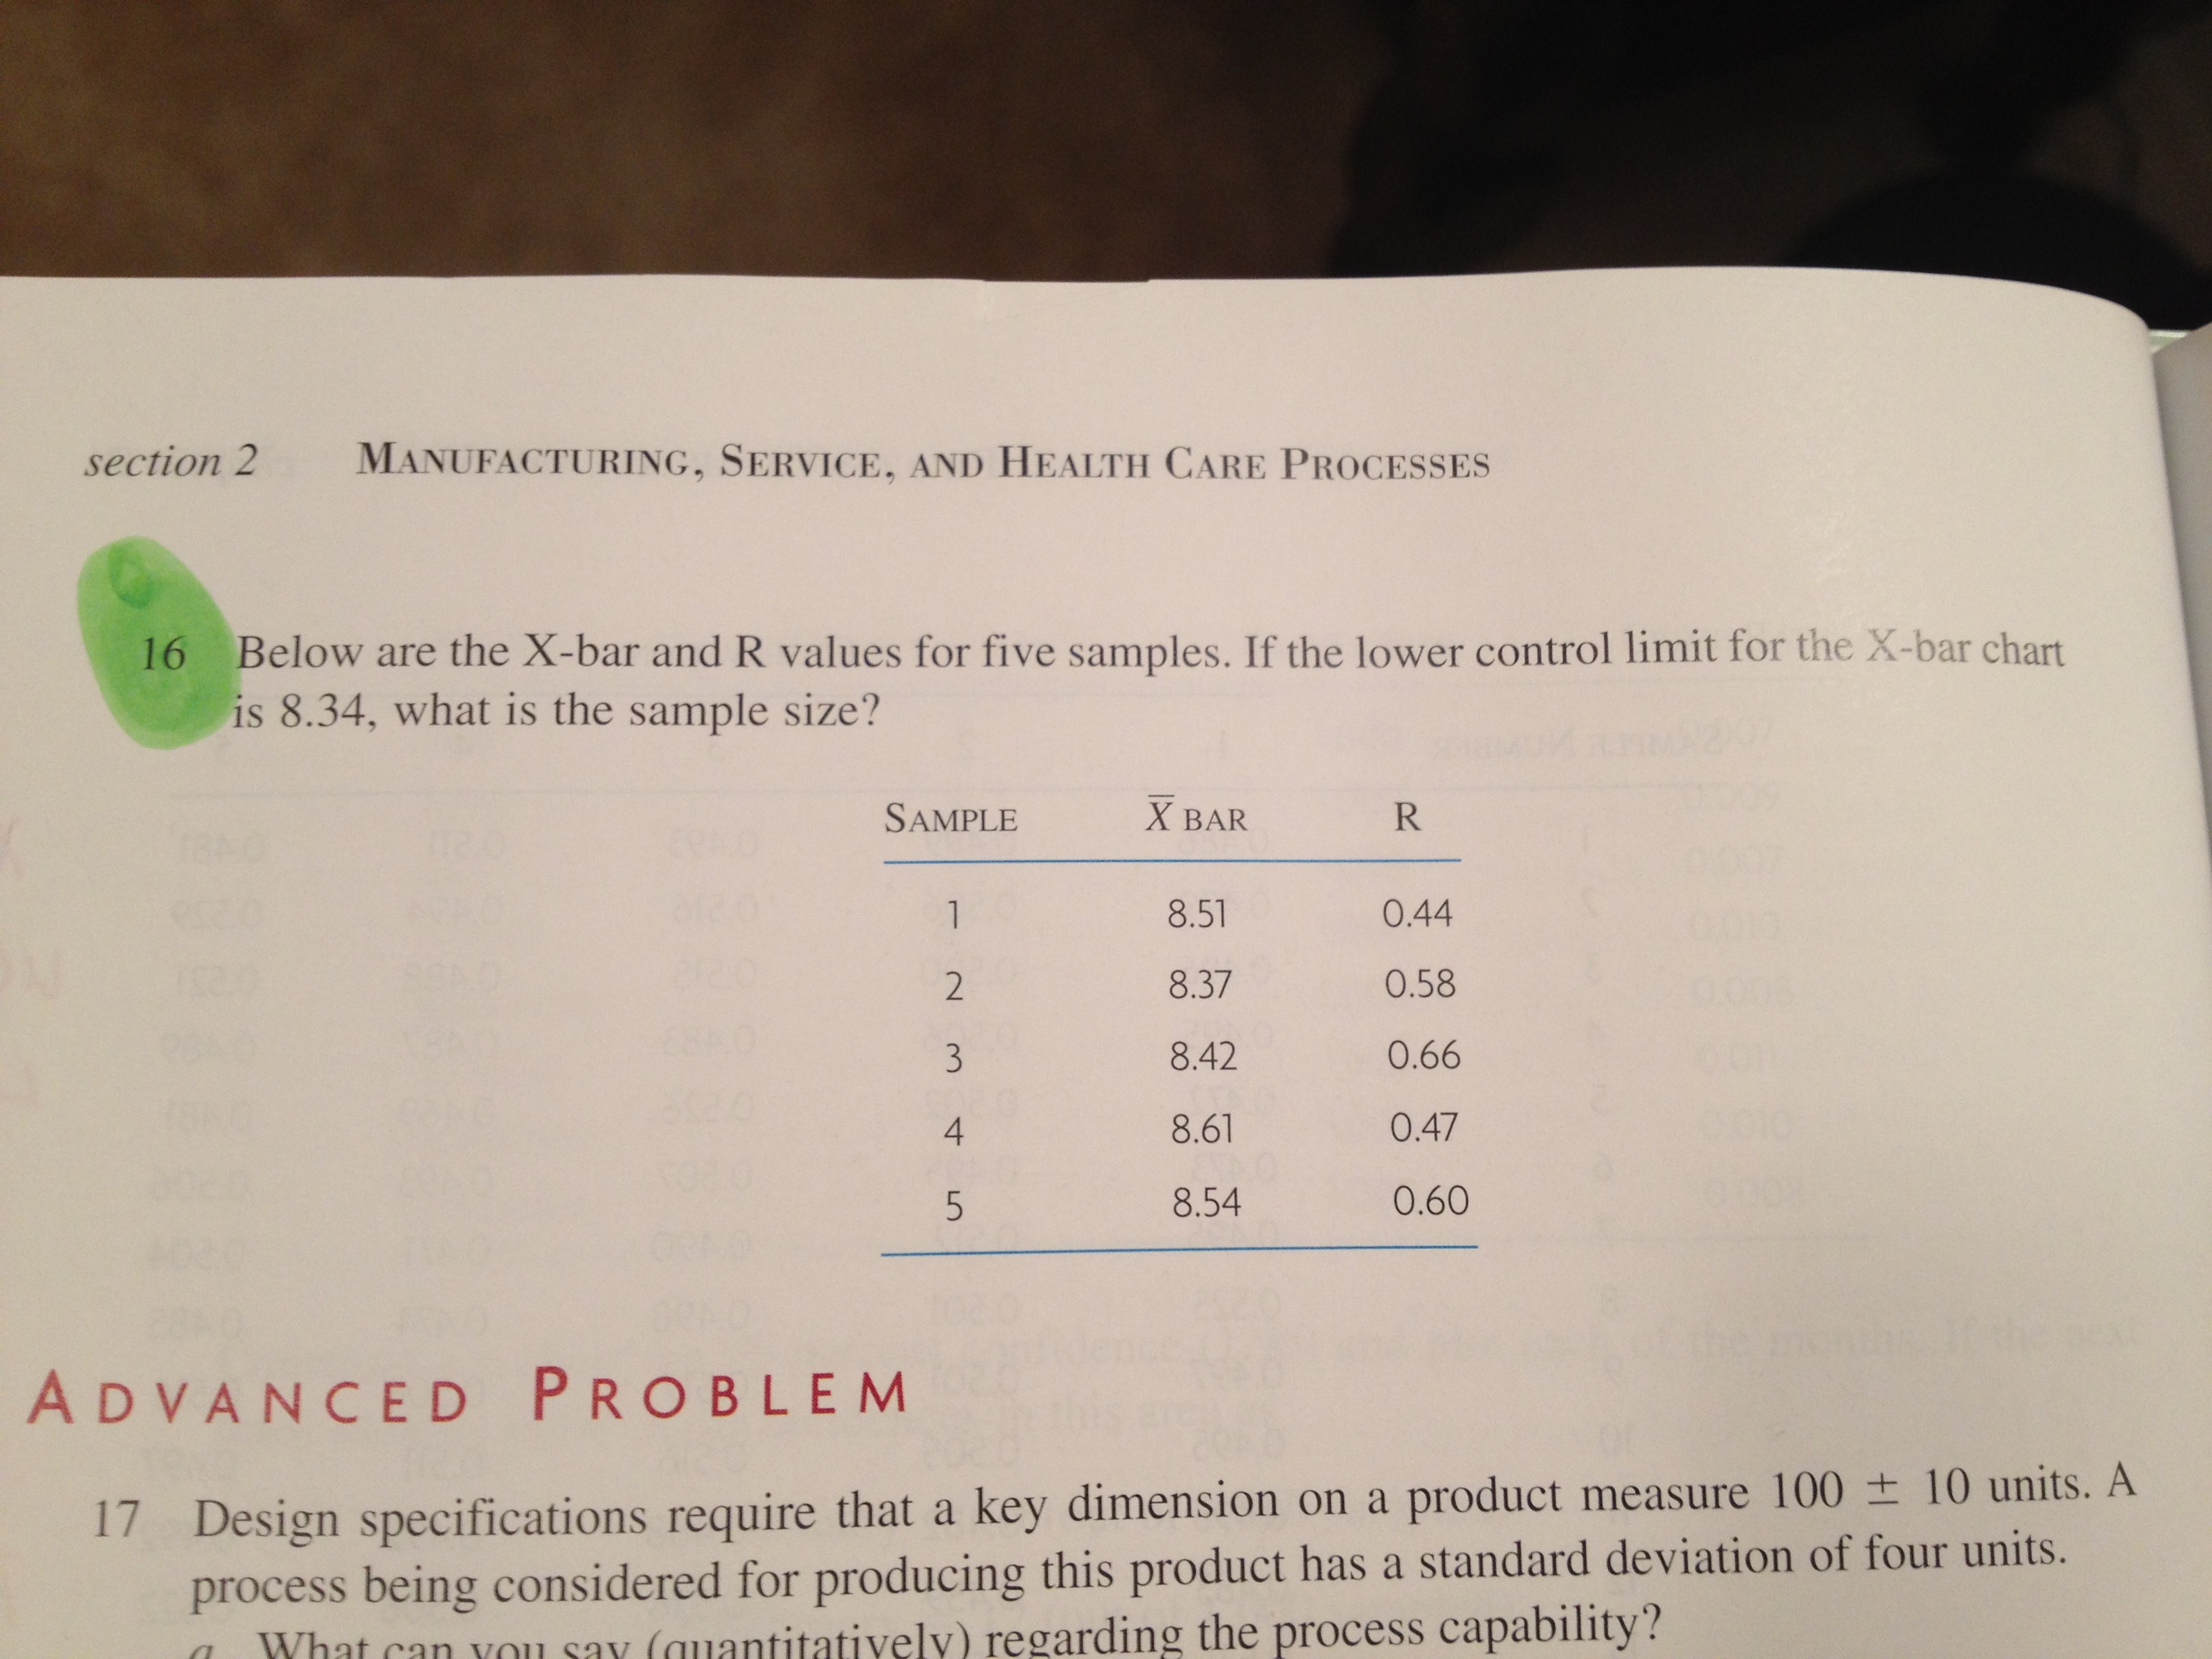
Below are the X-bar and R values for five samples. If the lower control limit for the X-bar chart is 8.34, what is the sample size?
See attachment for values.
Purchase this Solution
Solution Summary
Calculate the sample size is detailed on back-solving for the size-specific anti-biasing constant in an attached Excel file.
Purchase this Solution
Free BrainMass Quizzes
Know Your Statistical Concepts
Each question is a choice-summary multiple choice question that presents you with a statistical concept and then 4 numbered statements. You must decide which (if any) of the numbered statements is/are true as they relate to the statistical concept.
Terms and Definitions for Statistics
This quiz covers basic terms and definitions of statistics.
Measures of Central Tendency
This quiz evaluates the students understanding of the measures of central tendency seen in statistics. This quiz is specifically designed to incorporate the measures of central tendency as they relate to psychological research.
Measures of Central Tendency
Tests knowledge of the three main measures of central tendency, including some simple calculation questions.