Scatterplot, correlation coefficient, linear regression
Not what you're looking for?
See the attachments.
The regression equation and the standard error of estimate
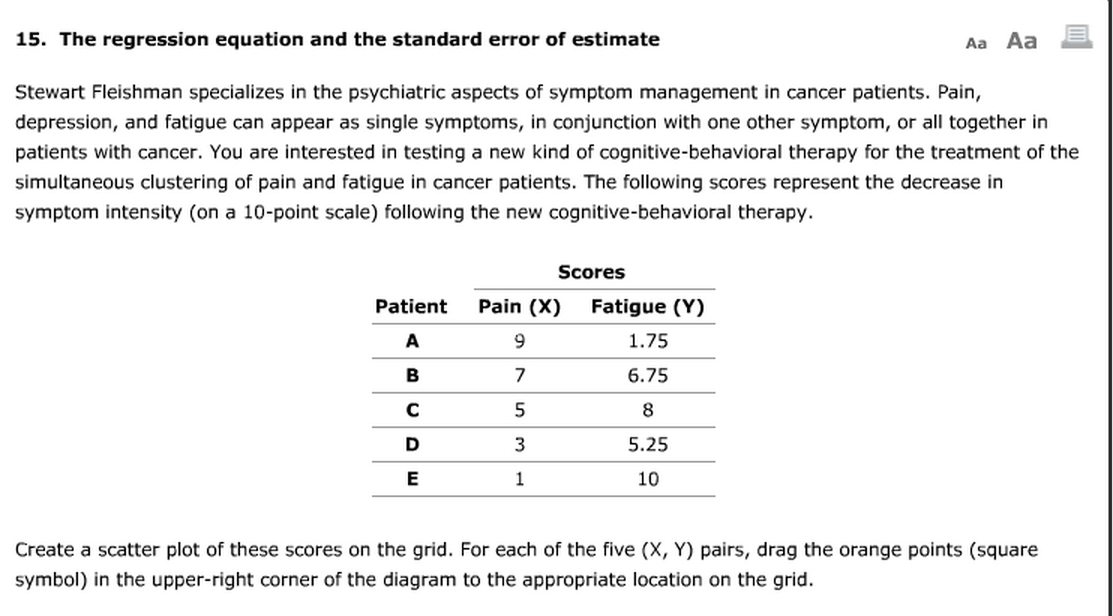
Stewart Fleishman specializes in the psychiatric aspects of symptom management in cancer patients. Pain, depression, and fatigue can appear as single symptoms, in conjunction with one other symptom, or all together in patients with cancer. You are interested in testing a new kind of cognitive-behavioral therapy for the treatment of the simultaneous clustering of pain and fatigue in cancer patients. The following scores represent the decrease in symptom intensity (on a 10-point scale) following the new cognitive-behavioral therapy
Patient Pain (X) Fatigue (Y)
A 9 1.75
B 7 6.75
C 5 8
D 3 5.25
E 1 10
Create a scatter plot of these scores on the grid. For each of the five (X, Y) pairs, drag the orange points (square symbol) in the upper-right corner of the diagram to the appropriate location on the grid.
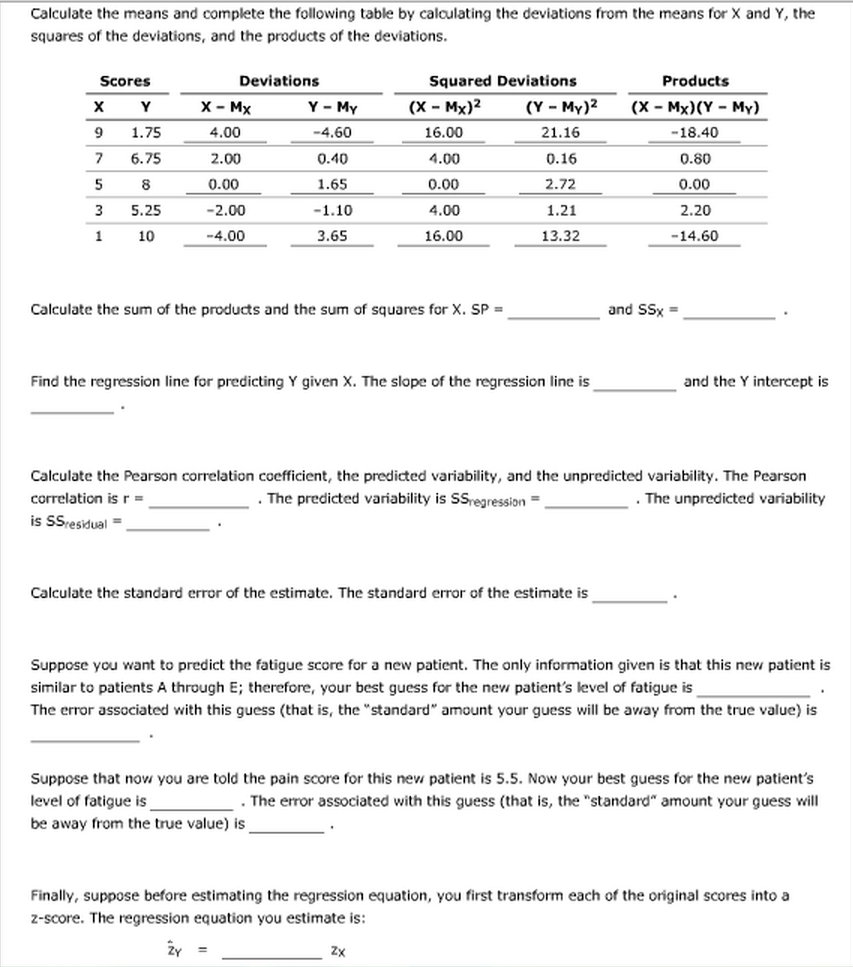
Calculate the means and complete the following table by calculating the deviations from the means for X and Y, the squares of the deviations, and the products of the deviations.
Scores Deviations Squared Deviations Products
X Y X-Mx Y-My (Y-Mx)^2 (Y-My)^2 (X-Mx)(Y-My)
9 1.75
7 6.75
5 8
3 5.25
1 10
Calculate the sum of the products and the sum of squares for X. SP = ______ and SSx = ______.
Find the regression line for predicting Y given X. The slope of the regression line is ______ and the Y intercept is ______.
Calculate the Pearson correlation coefficient, the predicted variability, and the unpredicted variability. The Pearson correlation is r = ______. The predicted variability is SSregression = ______. The unpredicted variability is SSresidual = ______
Calculate the standard error of the estimate. The standard error of the estimate is ______.
Suppose you want to predict the fatigue score for a new patient. The only information given is that this new patient is similar to patients A through E; therefore, your best guess for the new patient's level of fatigue is ______. The error associated with this guess (that is, the "standard" amount your guess will be away from the true value) is ______.
Suppose that now you are told the pain score for this new patient is 5.5. Now your best guess for the new patient's level of fatigue is ______. The error associated with this guess (that is, the "standard" amount your guess will be away from the true value) is ______.
Finally, suppose before estimating the regression equation, you first transform each of the original scores into a z-score. The regression equation you estimate is:
Z^y = ______ Zx
Purchase this Solution
Solution Summary
An Excel file containing the completed table, and showing the Excel functions used in the cells, is given along with a Word file containing explanations and final answers.
Education
- MSc, California State Polytechnic University, Pomona
- MBA, University of California, Riverside
- BSc, California State Polytechnic University, Pomona
- BSc, California State Polytechnic University, Pomona
Recent Feedback
- "Excellent work. Well explained."
- "Can you kindly take a look at 647530 and 647531. Thanks"
- "Thank you so very much. This is very well done and presented. I certainly appreciate your hard work. I am a novice at statistics and it is nice to know there are those out there who really do understand. Thanks again for an excellent posting. SPJ"
- "GREAT JOB!!!"
- "Hello, thank you for your answer for my probability question. However, I think you interpreted the second and third question differently than was meant, as the assumption still stands that a person still independently ranks the n options first. The probability I am after is the probability that this independently determined ranking then is equal to one of the p fixed rankings. Similarly for the third question, where the x people choose their ranking independently, and then I want the probability that for x people this is equal to one particular ranking. I was wondering if you could help me with this. "
Purchase this Solution
Free BrainMass Quizzes
Know Your Statistical Concepts
Each question is a choice-summary multiple choice question that presents you with a statistical concept and then 4 numbered statements. You must decide which (if any) of the numbered statements is/are true as they relate to the statistical concept.
Terms and Definitions for Statistics
This quiz covers basic terms and definitions of statistics.
Measures of Central Tendency
This quiz evaluates the students understanding of the measures of central tendency seen in statistics. This quiz is specifically designed to incorporate the measures of central tendency as they relate to psychological research.
Measures of Central Tendency
Tests knowledge of the three main measures of central tendency, including some simple calculation questions.