Hypothesis Testing, Confidence Interval & ANOVA Table
Not what you're looking for?
See attached files.
Can you please answer these but in addition please show entire work process & formula arrived at in Excel.
The following problems I am having difficulty with: 1, 2, 3, 7, 8.
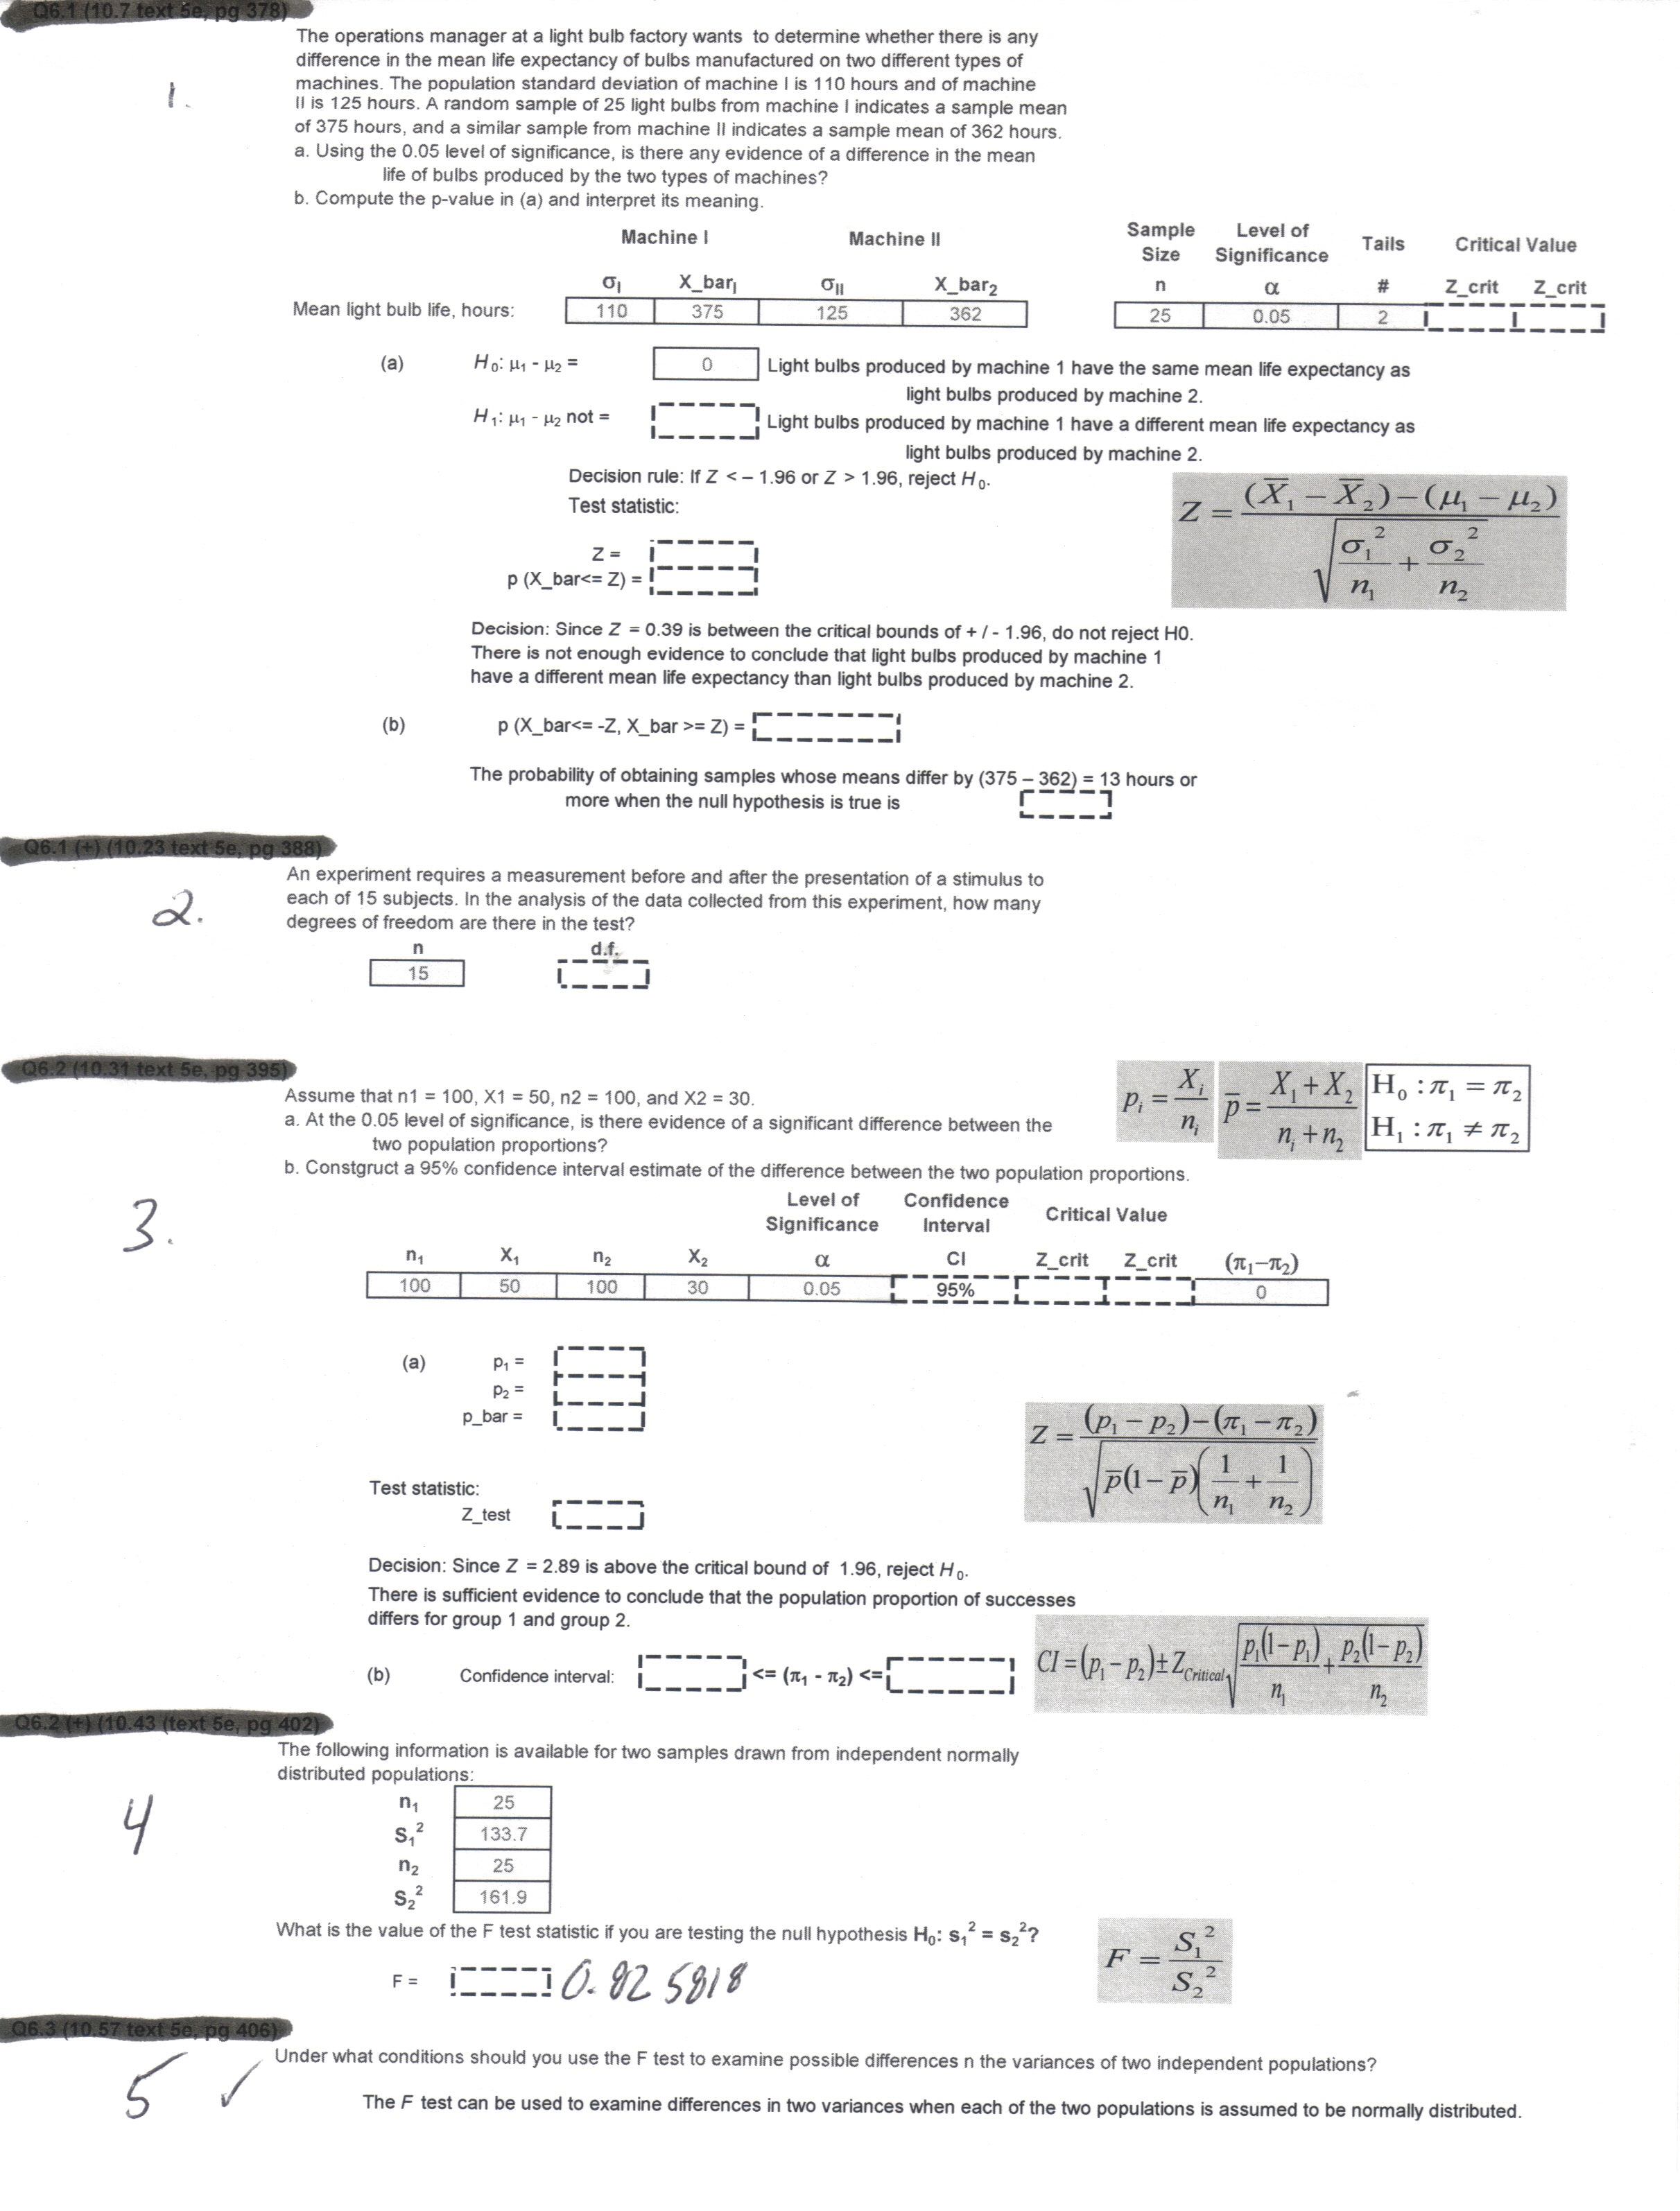
1. The operations manager at a light bulb factory wants to determine whether there is any difference in the mean life expectancy of bulbs manufactured on two different types of machines. The population standard deviation of machine I is 110 hours and of machine II is 125 hours. A random sample of 24 light bulbs from machine I indicates a sample mean of 375 hours and a similar sample of 25 bulbs from machine II indicates a sample mean of 362 hours.
a) Using a 0.05 level of significance, is there any evidence of a difference in the mean life of bulbs produced by the two types of machines?
b) Compute the p-value in (a) and interpret its meaning.
2. An experiment requires a measurement before and after the presentation of a stimulus to each of 15 subjects. In the analysis of the data collected from this experiment how many degrees of freedom are there in the test?
3. Assume that n1 = 100, X1 = 50, n2 = 100, X2 = 30.
a. At the 0.05 level of significance, is there evidence of a significant difference between the two population proportions?
b. Construct a 95% confidence interval estimate of the difference between the two population proportions.
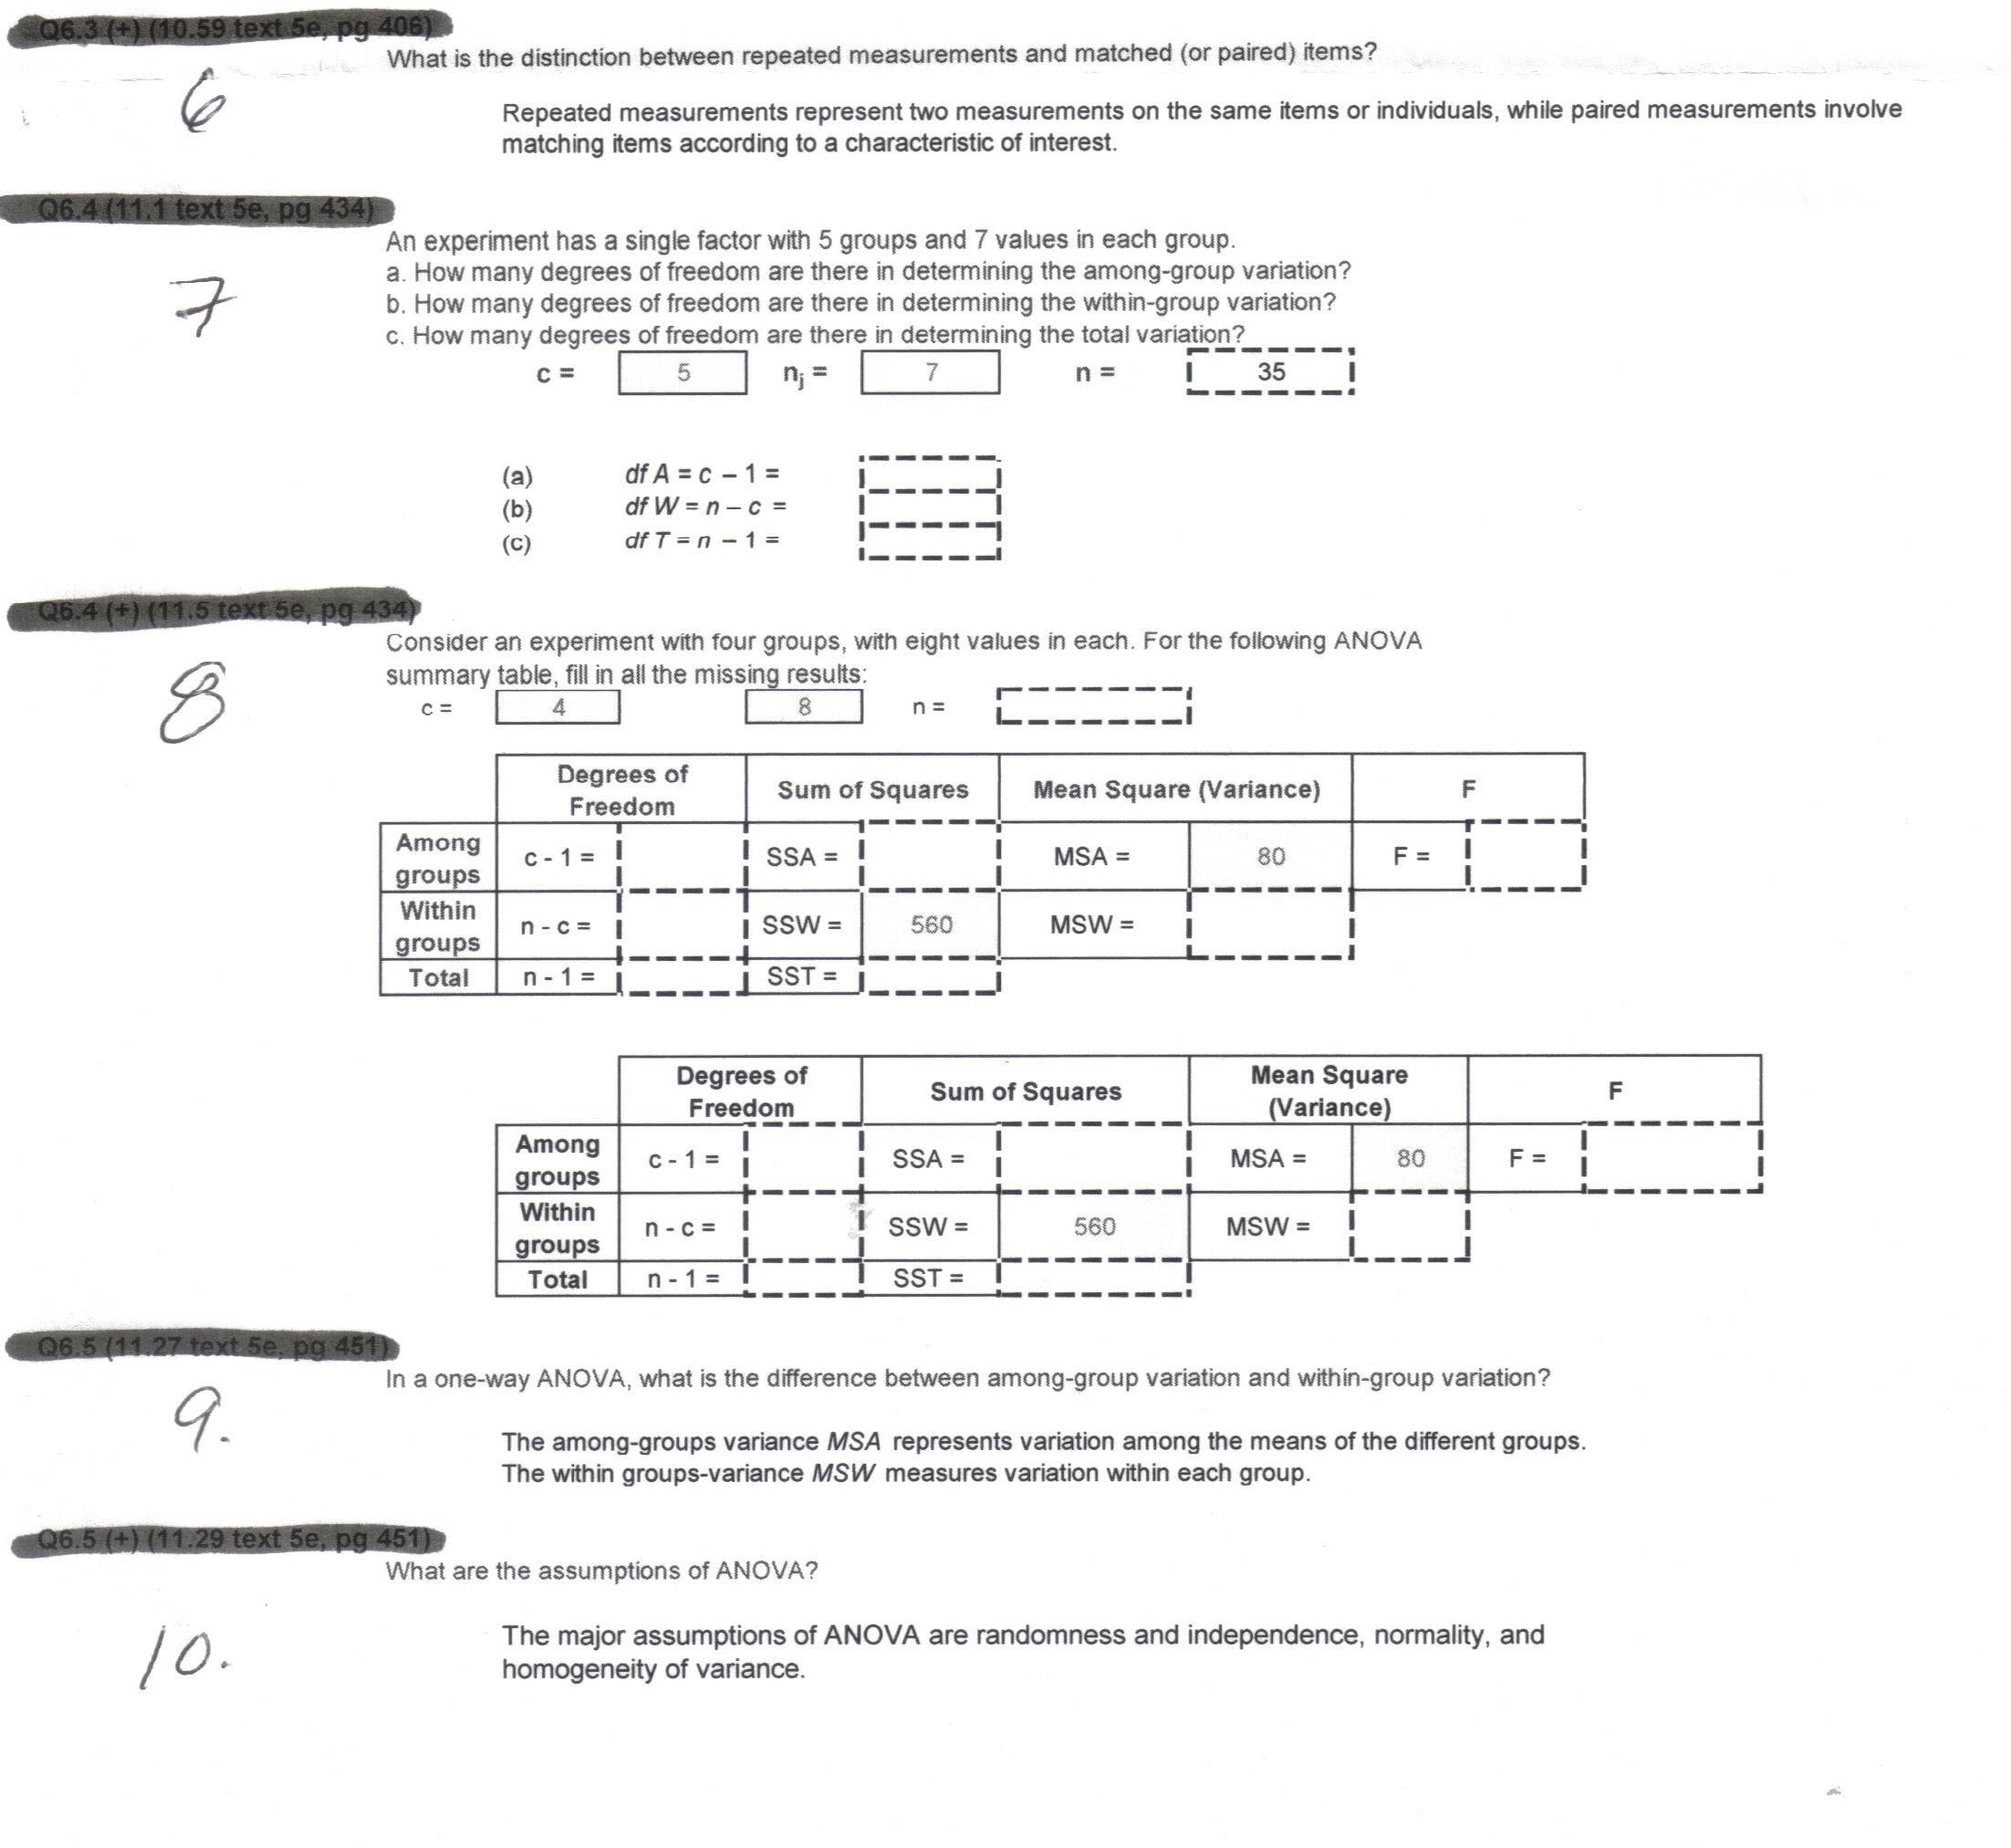
7. An experiment has a single factor with 5 groups and 7 values in each group.
a. How many degrees of freedom are there in determining the among-group variation?
b. How many degrees of freedom are there in determining the within-group variation?
c. How many degrees of freedom are there in determining the total variation?
8. Consider an experiment with four groups, with eight values in each. For the following ANOVA summary table, fill in all the missing results:
c = 4, n =
Degrees of Freedom Sum of Squares Mean Square (Variance) F
Among groups c - 1 = SSA = MSA = 80 F =
Within groups n = c = SSW = 560 MSW =
Total n - 1 = SST =
Purchase this Solution
Solution Summary
The solution provides step by step method for the calculation of testing of hypothesis. Formula for the calculation and Interpretations of the results are also included.
Purchase this Solution
Free BrainMass Quizzes
Measures of Central Tendency
Tests knowledge of the three main measures of central tendency, including some simple calculation questions.
Know Your Statistical Concepts
Each question is a choice-summary multiple choice question that presents you with a statistical concept and then 4 numbered statements. You must decide which (if any) of the numbered statements is/are true as they relate to the statistical concept.
Measures of Central Tendency
This quiz evaluates the students understanding of the measures of central tendency seen in statistics. This quiz is specifically designed to incorporate the measures of central tendency as they relate to psychological research.
Terms and Definitions for Statistics
This quiz covers basic terms and definitions of statistics.