Regression Analysis and Correlation Coefficient
Not what you're looking for?
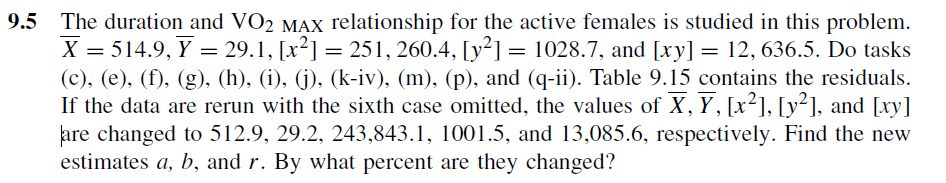
Please answer the 11 following questions about the attached problem. Please note that there are 4 attachments for this pb (the table is in two parts).
(c) Find the regression coefficients a and b.
(d) Place the regression line on the scatter diagram.
(e) Give s^2 xy and s xy.
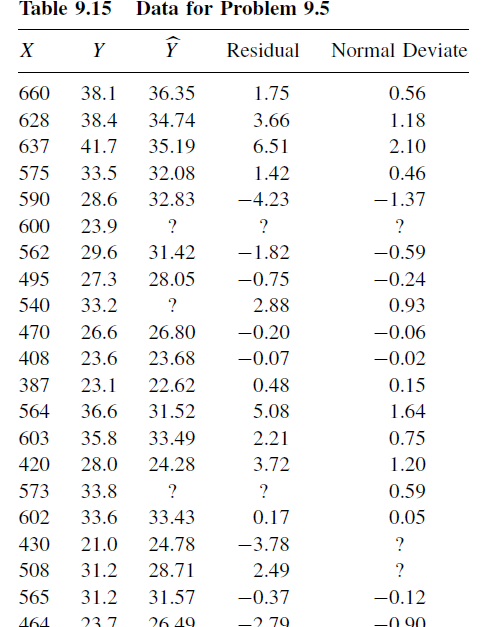
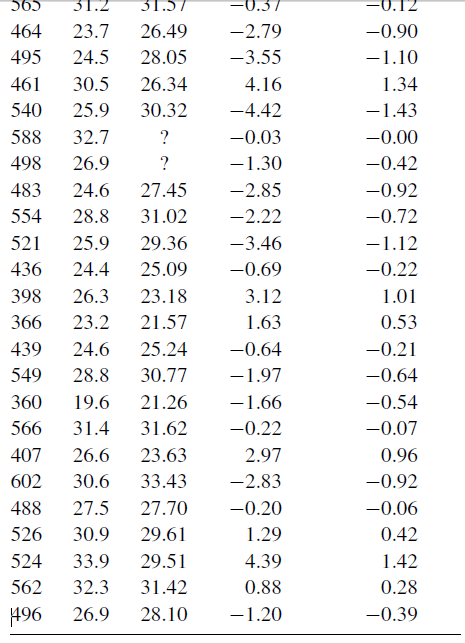
(f) Compute the missing predicted values, residuals, and normal deviates for the given portion of the table.
(g) Plot the residual plot.
(h) Interpret the residual plot.
(i) Plot the residual normal probability plot.
(j) Interpret the residual normal probability plot.
(k) iii. Compute the t -statistic for testing beta = 0. What can you say about its p-
value?
(m) Construct the anova table and use Table A.7 to give information about the p-
value.
(p) Compute the correlation coefficient r.
(q) ii. Construct the 95% confidence interval for r.
Purchase this Solution
Solution Summary
The solution provides step by step method for the calculation of regression analysis. Formula for the calculation and Interpretations of the results are also included.
Solution Preview
Please see the attachments.
If you have any doubt, please don't hesitate to contact me.
Questions for PB 9.5
Answers
(c) Find the regression coefficients a and b.
The general form of simple linear regression is Y= a + bX
Where Y is the dependent variable and X is the independent variable, a and be are known as the regression coefficients .They are estimated by the method of least squares. The estimates of a and b are given by
The parameter b measures the impact of unit change in X on the dependent variable Y. It is the slope of the regression line. The parameter a is the value of Y when X=0. It is known as the Intercept term.
The regression equation can be used to predict the value of Y for a given X. The predicted value of Y is given by
Given that X̅ = 514.9, Y̅ = 29.1, [x2] = 251260.4, [y2] = 1028.7, [xy] = 12636.5
The estimated value of slope = 0.0503
Estimated intercept = 3.2
The estimated regression equation is given by,
Y = 3.2 + 0.0503 * X
(d) Place the regression line on the scatter diagram.
(e) Give S^2(xy) and S(y,x)
= 9.59
= 3.097
(f) Compute the missing predicted values, residuals, and normal deviates for the given portion of the table.
Please see the excel sheet. The calculated values are highlighted in yellow.
Hint:
The missing predicted values are obtained by substituting ...
Purchase this Solution
Free BrainMass Quizzes
Know Your Statistical Concepts
Each question is a choice-summary multiple choice question that presents you with a statistical concept and then 4 numbered statements. You must decide which (if any) of the numbered statements is/are true as they relate to the statistical concept.
Measures of Central Tendency
Tests knowledge of the three main measures of central tendency, including some simple calculation questions.
Measures of Central Tendency
This quiz evaluates the students understanding of the measures of central tendency seen in statistics. This quiz is specifically designed to incorporate the measures of central tendency as they relate to psychological research.
Terms and Definitions for Statistics
This quiz covers basic terms and definitions of statistics.