Bode Plots and Harmonic Response
Not what you're looking for?
Please see attachment.
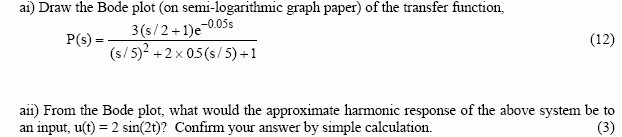
a) Draw the Bode plot (on semi-logarithmic graph paper) of the transfer function.
see attached
aii) From the Bode plot, what would the approximate harmonic response of the above system to an input, u(t)=sin(2t)? Confirm your answer by simple calculation.
Purchase this Solution
Solution Summary
Bode plots are calculated, and the resulting Bode plots (magnitude and phase plots) are added as an attachment. Additionally, the approximate harmonic response is calculated from the Bode plot by getting the magnitude and phase from the magnitude and phase plots, respectively.
Solution Preview
P(s) = 3( s/2 + 1) e^(-0.05s)/[(s/5)^2+2*0.5*(s/5)+1]
= 37.5*(s+2)/(s^2+5s+25)* e^(-0.05s)
ai) The Bode plot of P(S) is shown in the attached file.
The magnitude plot is exactly correct, but in the phase plot please include the effect of the time delay due to the e^(-0.05s) term by adding the term
-0.05w for each value of ...
Purchase this Solution
Free BrainMass Quizzes
Air Pollution Control - Environmental Science
Working principle of ESP
Architectural History
This quiz is intended to test the basics of History of Architecture- foundation for all architectural courses.