Simple Probability Questions
Not what you're looking for?
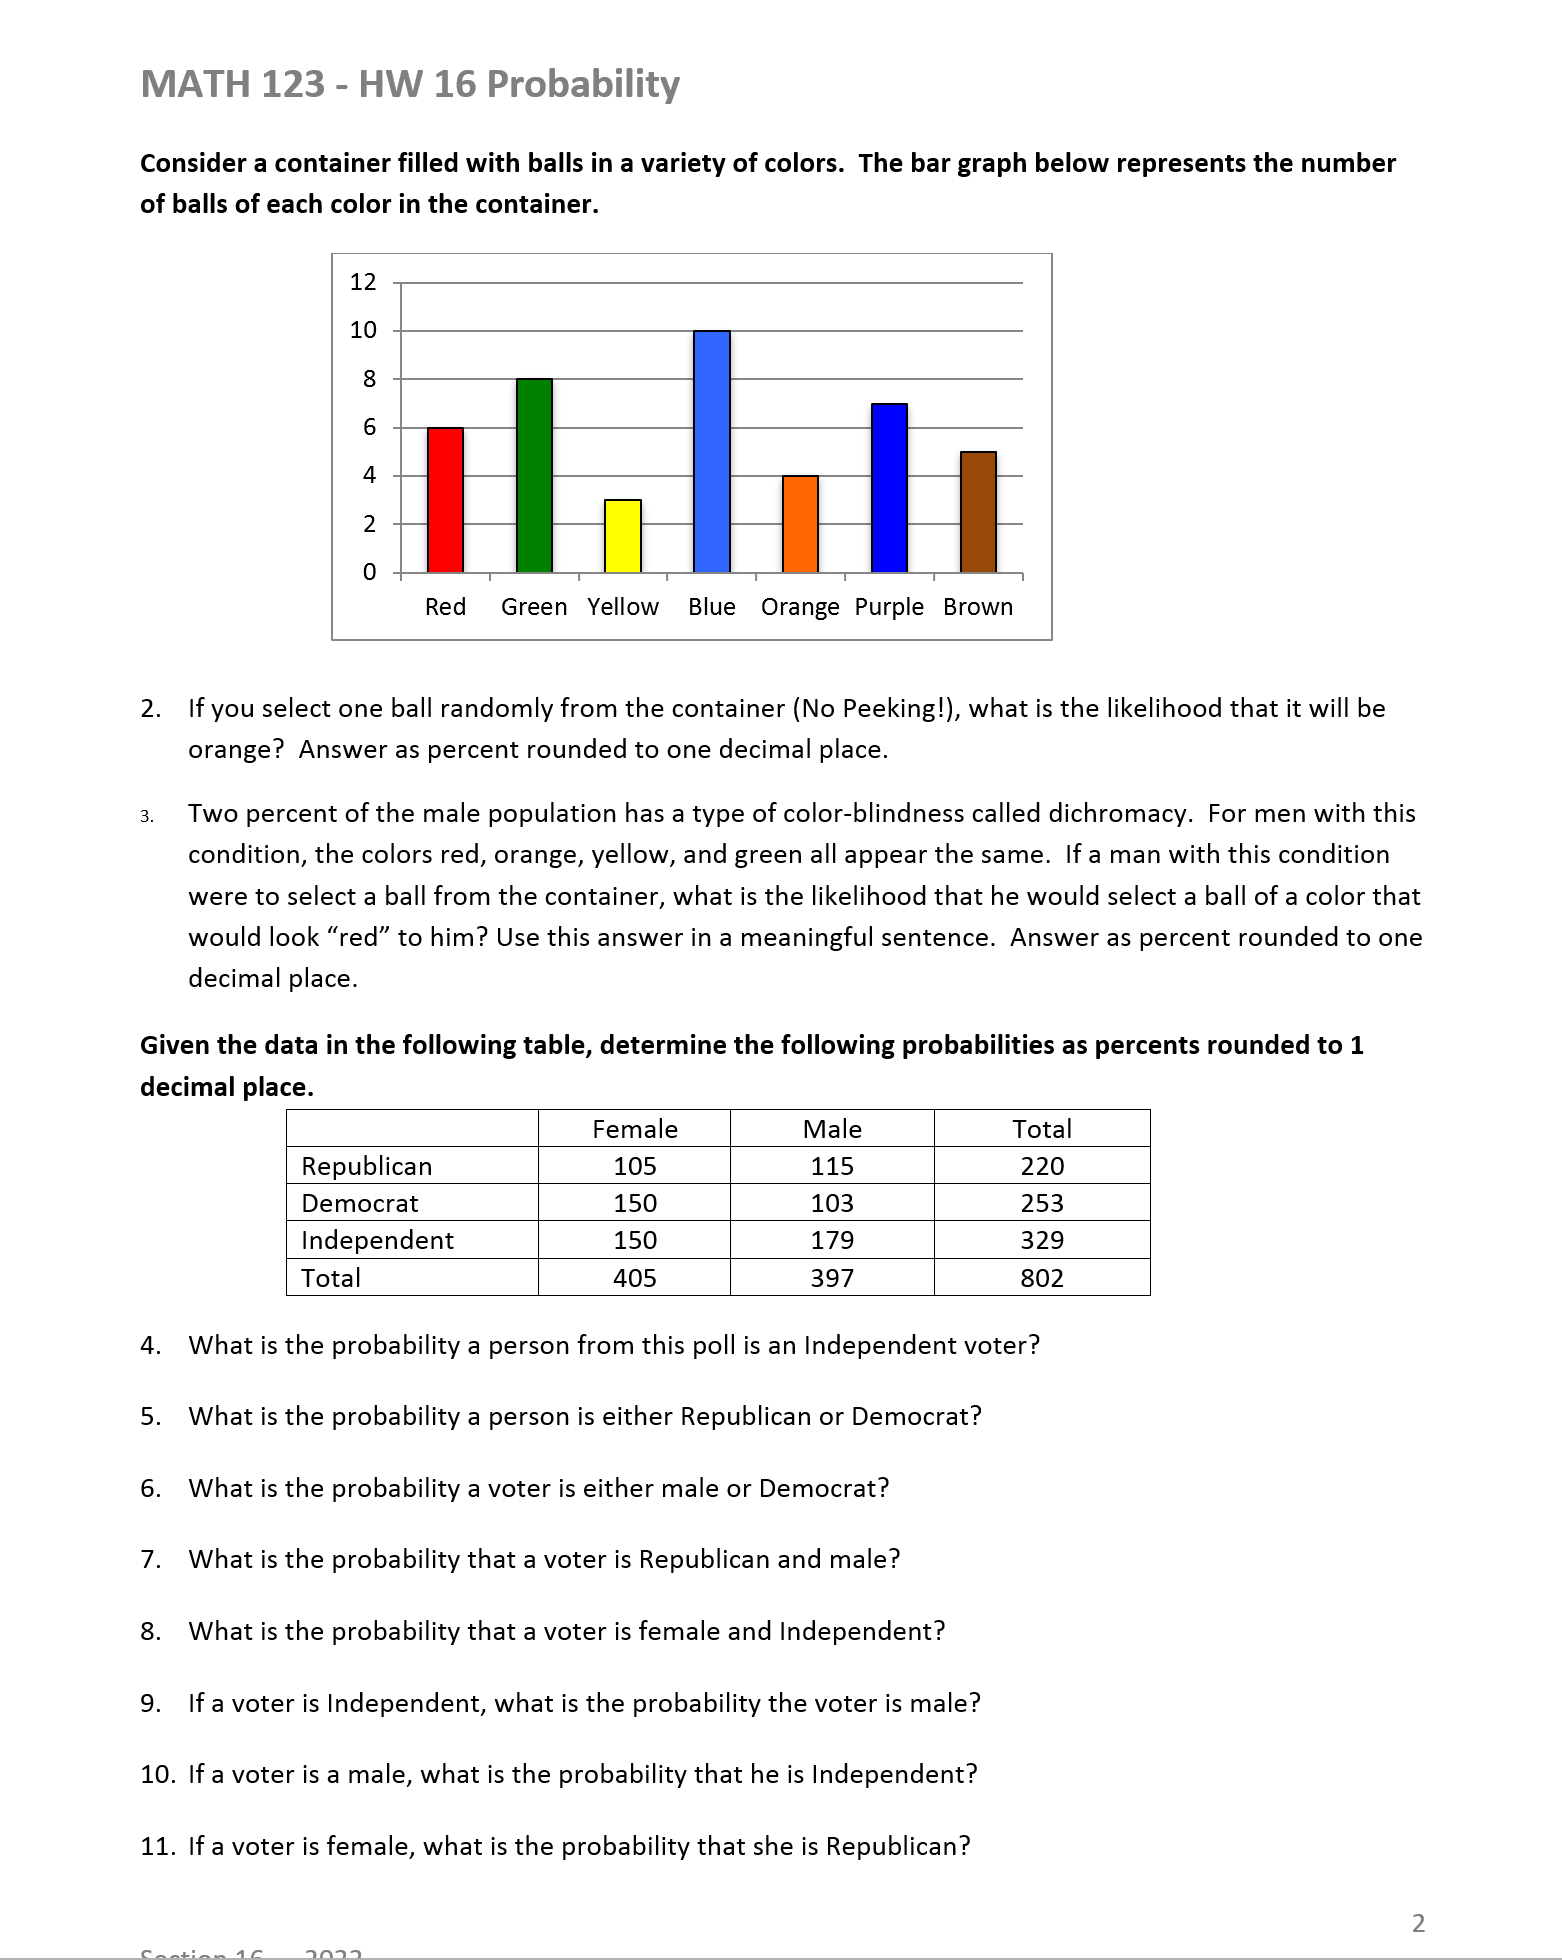
Consider a container filled with balls in a variety of colors. The bar graph below represents the number of balls of each color in the container.
Red Green Yellow Blue Orange Purple Brown
2. If you select one ball randomly from the container (No Peeking!), what is the likelihood that it will be orange? Answer as percent rounded to one decimal place.
3. Two percent of the male population has a type of color-blindness called dichromacy. For men with this condition, the colors red, orange, yellow, and green all appear the same. If a man with this condition were to select a ball from the container, what is the likelihood that he would select a ball of a color that would look "red" to him? Use this answer in a meaningful sentence. Answer as percent rounded to one decimal place.
Given the data in the following table, determine the following probabilities as percent rounded to 1 decimal place.
Female Male Total
Republican 105 115 220
Democrat 150 103 253
Independent 150 179 329
Total 405 397 802
4. What is the probability a person from this poll is an independent voter?
5. What is the probability a person is either Republican or Democrat?
6. What is the probability a voter is either male of Democrat?
7. What is the probability that a voter is Republican and male?
8. What is the probability that a voter is female and Independent?
9. If a voter is Independent, what is the probability the voter is male?
10. If a voter is male, what is the probability that he is Independent?
11. If a voter is female, what is the probability that she is a Republican?
Purchase this Solution
Solution Summary
Step by step calculations are shown for each question.
Solution Preview
2.
Note the number of balls of each color as follows:
The Red bar in the graph corresponds to the number 6.
The Green bar in the graph corresponds to the number 8.
The Yellow bar in the graph corresponds to the number 3.
The Blue bar in the graph corresponds to the number 10.
The Orange bar in the graph corresponds to the number 4.
The Purple bar in the graph corresponds to the number 7.
The Brown bar in the graph corresponds to the number 5.
Add all of the numbers above.
6 + 8 + 3 + 10 + 4 + 7 + 5 = 43
Recall: The ...
Education
- MSc, California State Polytechnic University, Pomona
- MBA, University of California, Riverside
- BSc, California State Polytechnic University, Pomona
- BSc, California State Polytechnic University, Pomona
Recent Feedback
- "Excellent work. Well explained."
- "Can you kindly take a look at 647530 and 647531. Thanks"
- "Thank you so very much. This is very well done and presented. I certainly appreciate your hard work. I am a novice at statistics and it is nice to know there are those out there who really do understand. Thanks again for an excellent posting. SPJ"
- "GREAT JOB!!!"
- "Hello, thank you for your answer for my probability question. However, I think you interpreted the second and third question differently than was meant, as the assumption still stands that a person still independently ranks the n options first. The probability I am after is the probability that this independently determined ranking then is equal to one of the p fixed rankings. Similarly for the third question, where the x people choose their ranking independently, and then I want the probability that for x people this is equal to one particular ranking. I was wondering if you could help me with this. "
Purchase this Solution
Free BrainMass Quizzes
Terms and Definitions for Statistics
This quiz covers basic terms and definitions of statistics.
Know Your Statistical Concepts
Each question is a choice-summary multiple choice question that presents you with a statistical concept and then 4 numbered statements. You must decide which (if any) of the numbered statements is/are true as they relate to the statistical concept.
Measures of Central Tendency
Tests knowledge of the three main measures of central tendency, including some simple calculation questions.
Measures of Central Tendency
This quiz evaluates the students understanding of the measures of central tendency seen in statistics. This quiz is specifically designed to incorporate the measures of central tendency as they relate to psychological research.