MATH 123 HW 16 Probability
Not what you're looking for?
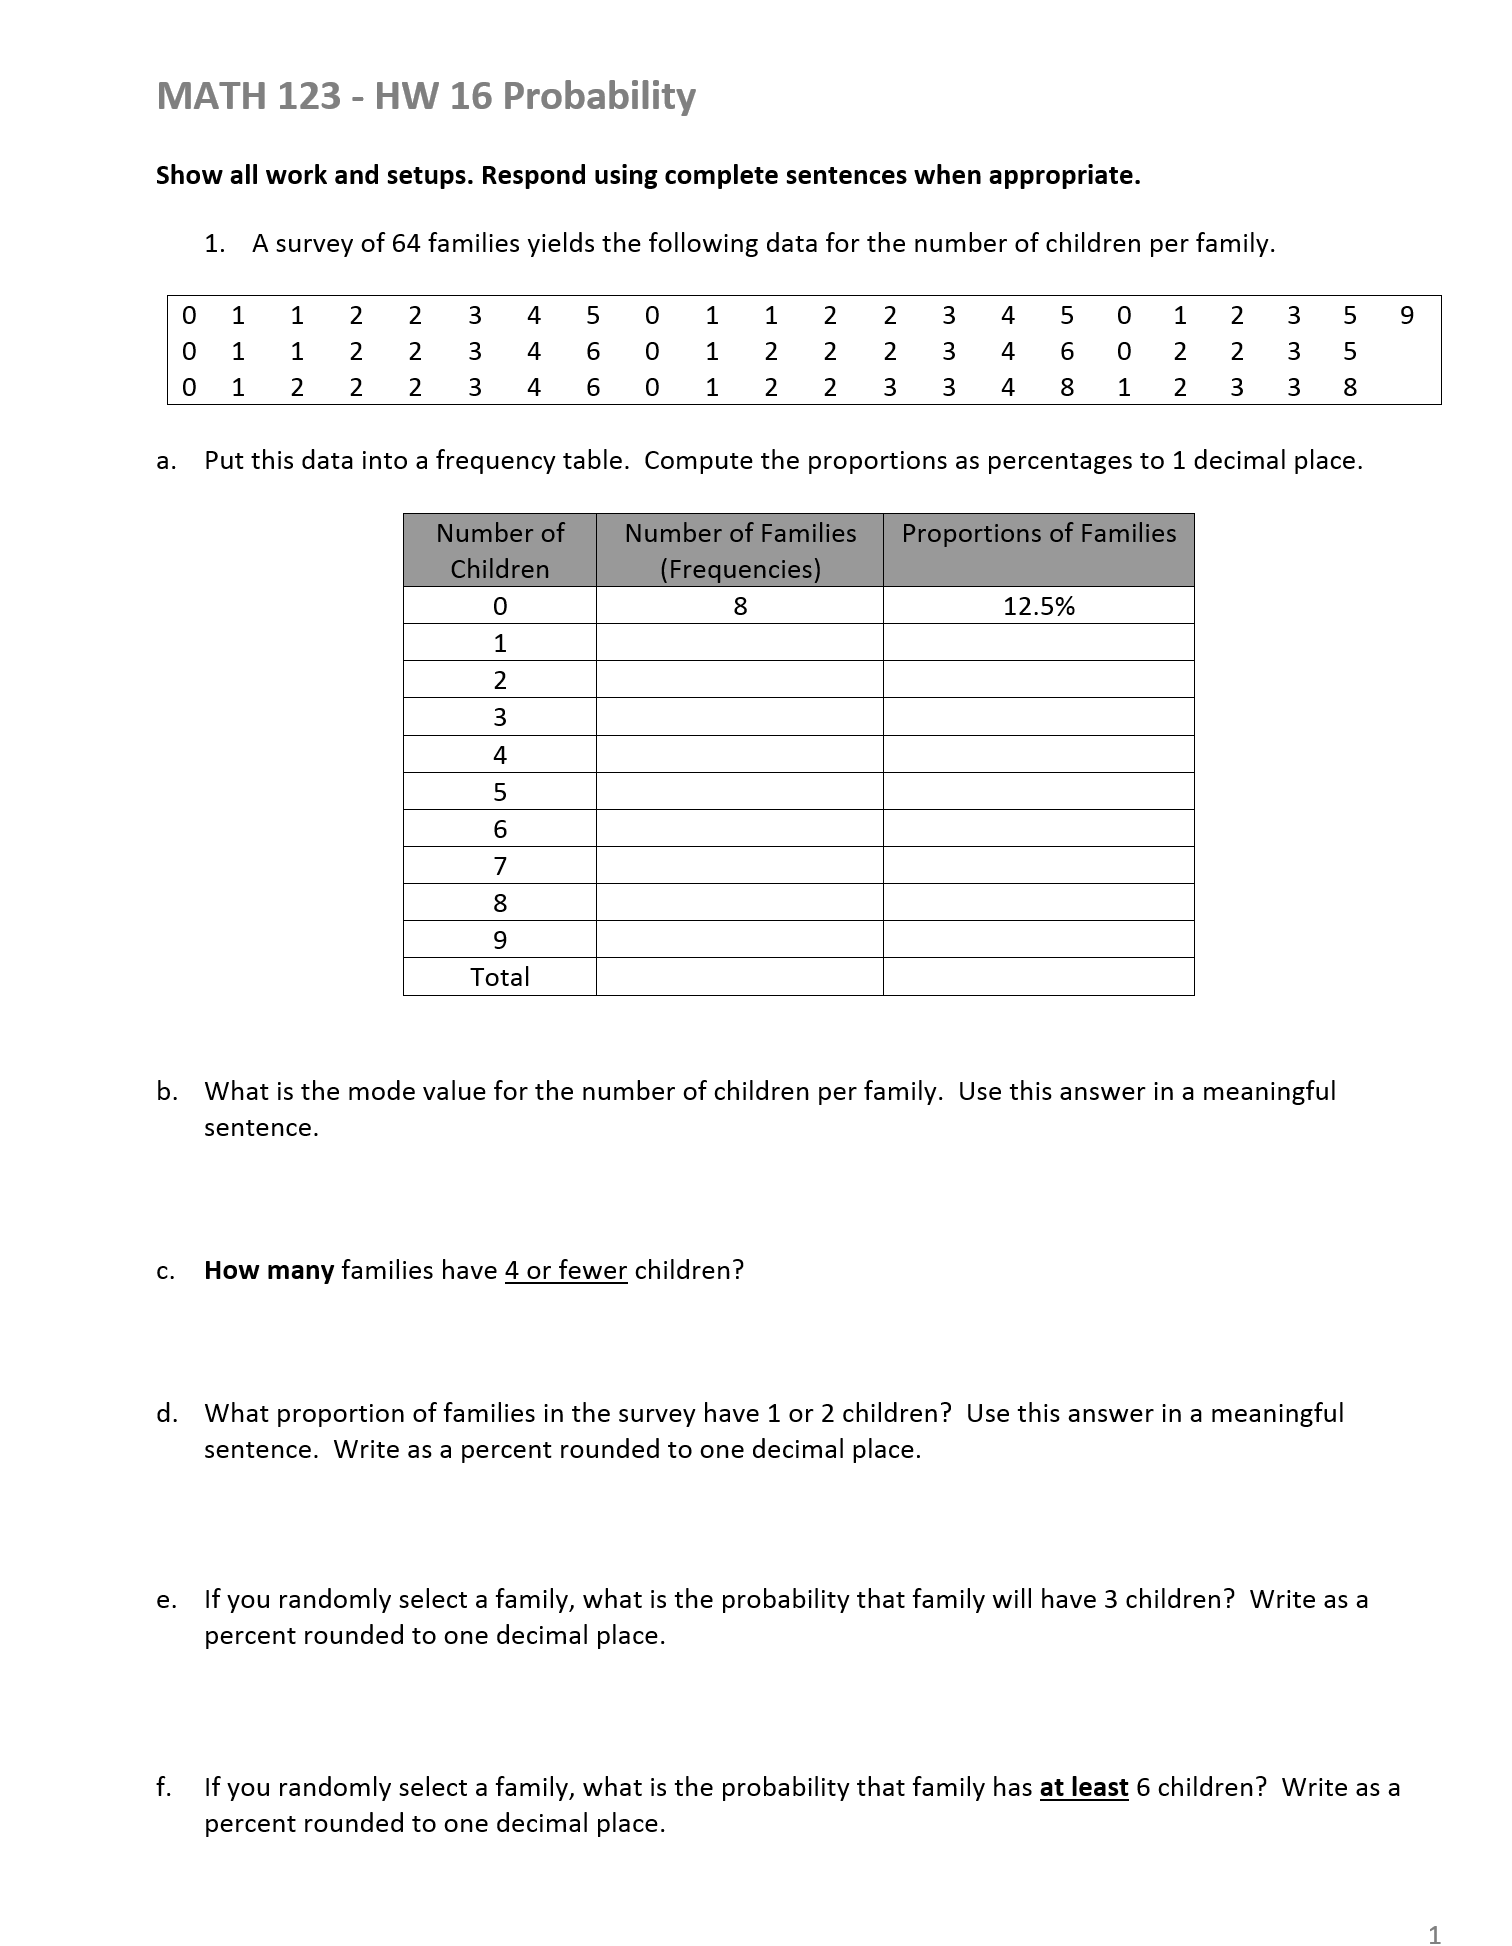
A survey of 64 families yields the following data for the number of children per family.
a. Put this data into a frequency table. Compute the proportions as percentages to 1 decimal place.
b. What is the mode value for the number of children per family? Use this answer in a meaningful sentence.
c. How many families have 4 or fewer children?
d. What proportion of families in the survey have 1 or 2 children? Use this answer in a meaningful sentence. Write as a percent rounded to one decimal place.
e. If you randomly select a family, what is the probability that family will have 3 children? Write as a percent rounded to one decimal place.
f. If you randomly select a family, what is the probability that family has at least 6 children? Write as a percent rounded to one decimal place.
Purchase this Solution
Solution Summary
Step-by-step solutions are given.
Solution Preview
a)
Count how many times each number occurs in the table.
0 occurs 8 times
1 occurs 11 times
2 occurs 18 times
3 occurs 11 times.
4 occurs 6 times.
5 occurs 4 times.
6 occurs 3 times.
7 occurs 0 times.
8 occurs 2 times.
9 occurs 1 time.
Organize these numbers in the table. Use the frequencies and total to calculate the proportions as shown.
Number of Children Number of Families (Frequencies) Proportions of Families
0 8 8/64 = 12.5%
1 11 11/64 = ...
Education
- MSc, California State Polytechnic University, Pomona
- MBA, University of California, Riverside
- BSc, California State Polytechnic University, Pomona
- BSc, California State Polytechnic University, Pomona
Recent Feedback
- "Excellent work. Well explained."
- "Can you kindly take a look at 647530 and 647531. Thanks"
- "Thank you so very much. This is very well done and presented. I certainly appreciate your hard work. I am a novice at statistics and it is nice to know there are those out there who really do understand. Thanks again for an excellent posting. SPJ"
- "GREAT JOB!!!"
- "Hello, thank you for your answer for my probability question. However, I think you interpreted the second and third question differently than was meant, as the assumption still stands that a person still independently ranks the n options first. The probability I am after is the probability that this independently determined ranking then is equal to one of the p fixed rankings. Similarly for the third question, where the x people choose their ranking independently, and then I want the probability that for x people this is equal to one particular ranking. I was wondering if you could help me with this. "
Purchase this Solution
Free BrainMass Quizzes
Know Your Statistical Concepts
Each question is a choice-summary multiple choice question that presents you with a statistical concept and then 4 numbered statements. You must decide which (if any) of the numbered statements is/are true as they relate to the statistical concept.
Measures of Central Tendency
Tests knowledge of the three main measures of central tendency, including some simple calculation questions.
Terms and Definitions for Statistics
This quiz covers basic terms and definitions of statistics.
Measures of Central Tendency
This quiz evaluates the students understanding of the measures of central tendency seen in statistics. This quiz is specifically designed to incorporate the measures of central tendency as they relate to psychological research.