Two Segment Graph : Equation of Tangent and Calculation of Points
Not what you're looking for?
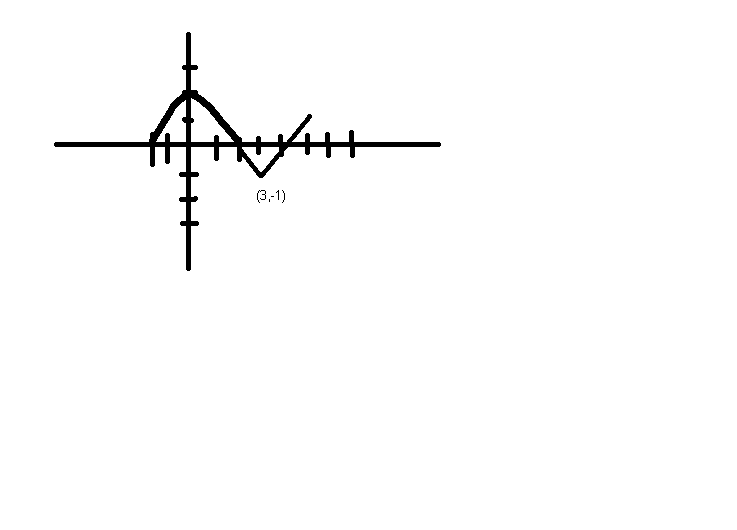
Please note: On the attached graph the scale is that each line represents one unit. Please show all work, thanks!!
The graph of F consists of a semicircle and two line segments as shown (please see the attachment). Let g be the function given by:
g(x)= def.integral from 0 to x f(t)dt.
a Find g(3).
b Find all value of x on the open interval (-2,5) at which g has a relative maximum. Justify.
c Write an equation for the line tangent to the graph of g at x=3.
d Find the x coordinate of each point of inflection of the graph g on the open interval (-2,5). Justify.
Purchase this Solution
Solution Summary
A two segment graph is analyzed to find the equation of a tangent line and to calculate point values.
Solution Preview
Please see the attached file for the full solution.
Thanks for using BrainMass.
Please note: On the attached graph the scale is that each line represents one unit. Please show all work, thanks!!
The graph of F consists of a semicircle and two line segments as shown (see attachment). Let g be the function given by:
a ...
Education
- BSc , Wuhan Univ. China
- MA, Shandong Univ.
Recent Feedback
- "Your solution, looks excellent. I recognize things from previous chapters. I have seen the standard deviation formula you used to get 5.154. I do understand the Central Limit Theorem needs the sample size (n) to be greater than 30, we have 100. I do understand the sample mean(s) of the population will follow a normal distribution, and that CLT states the sample mean of population is the population (mean), we have 143.74. But when and WHY do we use the standard deviation formula where you got 5.154. WHEN & Why use standard deviation of the sample mean. I don't understand, why don't we simply use the "100" I understand that standard deviation is the square root of variance. I do understand that the variance is the square of the differences of each sample data value minus the mean. But somehow, why not use 100, why use standard deviation of sample mean? Please help explain."
- "excellent work"
- "Thank you so much for all of your help!!! I will be posting another assignment. Please let me know (once posted), if the credits I'm offering is enough or you ! Thanks again!"
- "Thank you"
- "Thank you very much for your valuable time and assistance!"
Purchase this Solution
Free BrainMass Quizzes
Graphs and Functions
This quiz helps you easily identify a function and test your understanding of ranges, domains , function inverses and transformations.
Probability Quiz
Some questions on probability
Solving quadratic inequalities
This quiz test you on how well you are familiar with solving quadratic inequalities.
Multiplying Complex Numbers
This is a short quiz to check your understanding of multiplication of complex numbers in rectangular form.
Geometry - Real Life Application Problems
Understanding of how geometry applies to in real-world contexts