Graph the function f(x) over the given interval
Not what you're looking for?
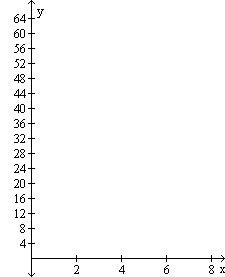
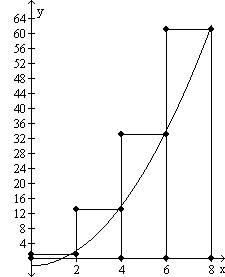
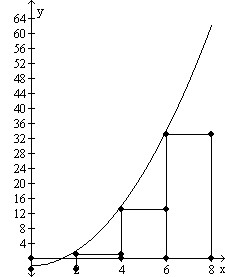
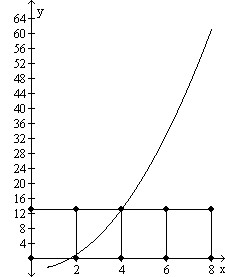
Graph the function f(x) over the given interval. Partition the interval into 4 subintervals of equal length. Then add to your sketch the rectangles associated with the Riemann sum (attached), using the indicated point in the kth subinterval for ck.
f(x) = x2 - 3, [0, 8], midpoint
(Graph is also attached)
Answer Options:
Attached
Purchase this Solution
Solution Summary
The Correct Answer is provided.
Purchase this Solution
Free BrainMass Quizzes
Probability Quiz
Some questions on probability
Multiplying Complex Numbers
This is a short quiz to check your understanding of multiplication of complex numbers in rectangular form.
Geometry - Real Life Application Problems
Understanding of how geometry applies to in real-world contexts
Know Your Linear Equations
Each question is a choice-summary multiple choice question that will present you with a linear equation and then make 4 statements about that equation. You must determine which of the 4 statements are true (if any) in regards to the equation.
Solving quadratic inequalities
This quiz test you on how well you are familiar with solving quadratic inequalities.