C-chart
Not what you're looking for?
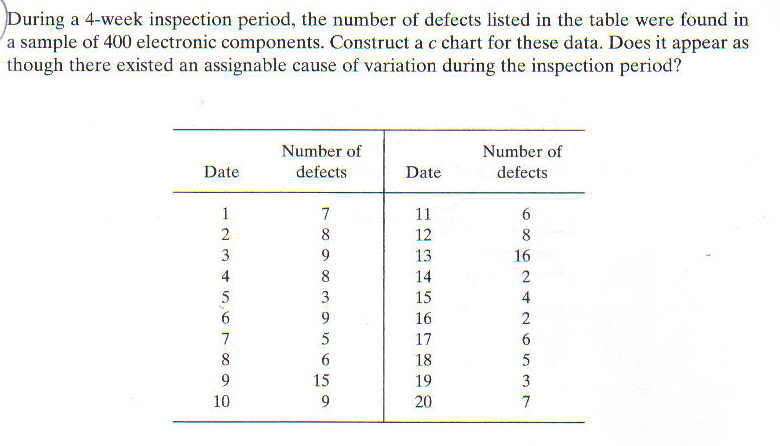
During a 4 week inspection period, the number of defects listed in the table were found in a sample of 400 electronic components. Construct a c chart for these data. Does it appear as though there existed an assignable cause of variation during inspection period?
See attached file for full problem description.
Purchase this Solution
Solution Summary
A problem on C-chart
Purchase this Solution
Free BrainMass Quizzes
IPOs
This Quiz is compiled of questions that pertain to IPOs (Initial Public Offerings)
Six Sigma for Process Improvement
A high level understanding of Six Sigma and what it is all about. This just gives you a glimpse of Six Sigma which entails more in-depth knowledge of processes and techniques.
Income Streams
In our ever changing world, developing secondary income streams is becoming more important. This quiz provides a brief overview of income sources.
Cost Concepts: Analyzing Costs in Managerial Accounting
This quiz gives students the opportunity to assess their knowledge of cost concepts used in managerial accounting such as opportunity costs, marginal costs, relevant costs and the benefits and relationships that derive from them.
Team Development Strategies
This quiz will assess your knowledge of team-building processes, learning styles, and leadership methods. Team development is essential to creating and maintaining high performing teams.