Interpret sales tables and give CEO advice
Not what you're looking for?
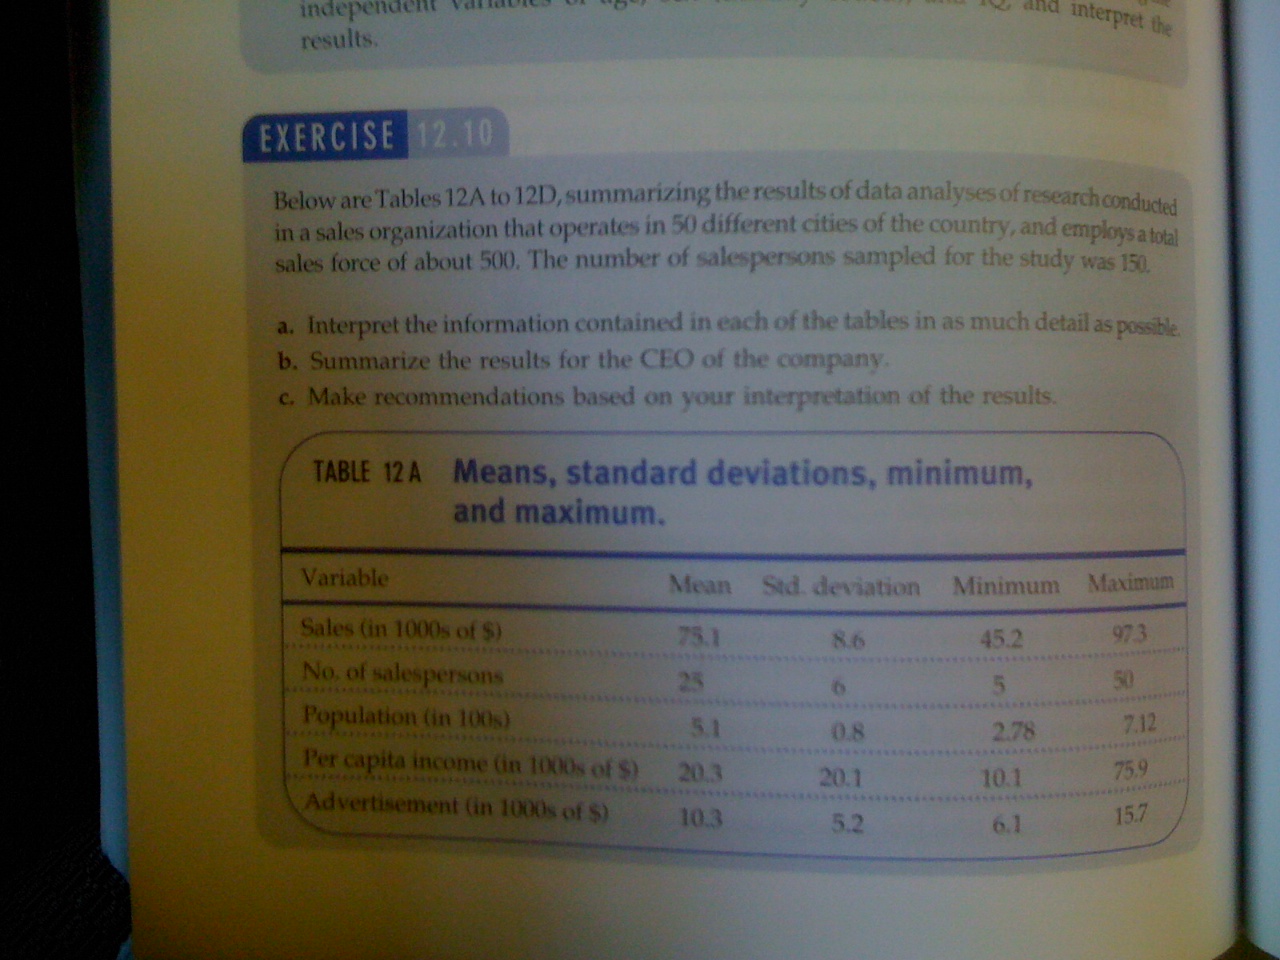
I'm trying to summarize these tables from a practice exercise. I'm not exactly sure how to summarize these tables to interpret the means, standard deviations, minimum and maximum, correlations, ANOVA and regression analysis.
a. I need to interpret the information in each of the table in detail.
b. Provide a summary of the table so a CEO may understand.
c. Make recommendation based on the interpretation.
From discussion, I know I need to determine the IVs and DV of the study. The organization is trying to investigate the affect of sales in the company. The population in the table is 100,000 not 100s which is a misprint. The data presented in these tables are obtained from the sample (n=150). It's not clear what sampling method was used.
In Table 12A, I assume that the sales represent the sales amount of the cities sampled in the study. Same thing for the rest of the variables. The unit probably was the city. I need to investigate Tables 12B, 12C, and 12D are investigating the relationships between different IVs and the DV.
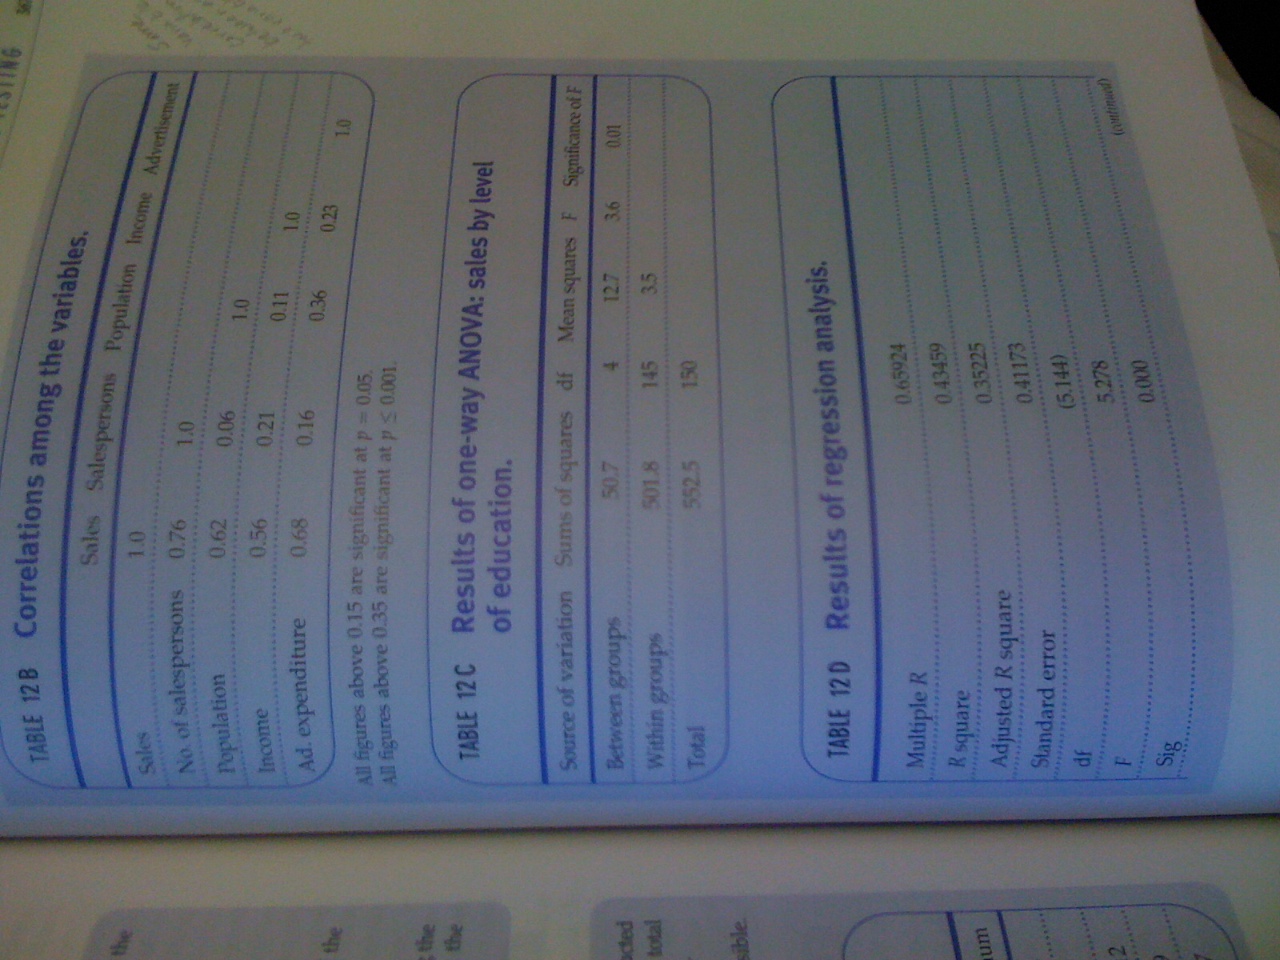
For Table 12C, what conclusions can be draw just based on the results presented?
What is the IV, what is the DV in this test?
How many levels are there for education?
What is the F test referring?
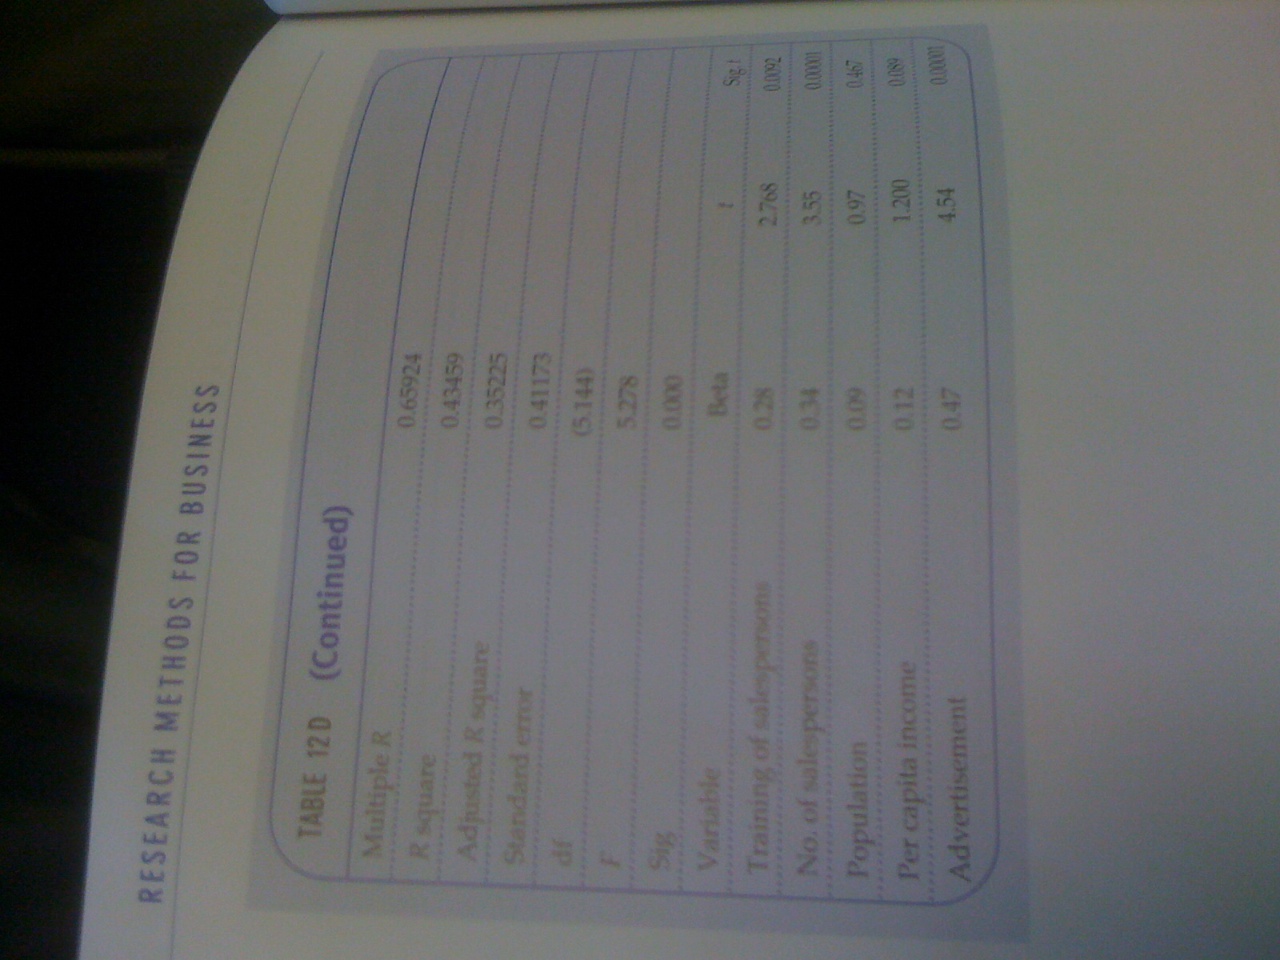
For Table 12D, a multiple regression test was run as it appears.
What are the IVs in the regression model?
What is the R square (more specifically, the adjusted R square) telling us?
What does the F test tell us?
Then for each individual IV, in order to see if that IV is significantly affecting the DV in the regression model, the Beta test was run, and a t value (and t's p value) would tell you that.
The results being interpreted in respect to each table. So, for each table, there needs to be some interpretation.
Table 12 A Means, standard deviations, minimum, and maximum
variables Mean Std. deviation Minimum Maximum
Sales (in 1000s of $) 75.1 8.6 45.2 97.3
No. of salesperson 25 6 5 50
Population (100,000) 5.1 0.8 2.78 7.12
Per Capita income (in 1000s of $) 20.3 20.1 10.1 75.9
Advertisement (in 1000s of $) 10.3 5.2 6.1 15.7
Table 12 B Correlation among the variables
Sales Salesperson Population Income Advertisement
Sales 1
No. of salesperson 0.76 1
Population 0.62 0.06 1
income 0.56 0.21 0.11 1
Ad. Expenditure 0.68 0.16 0.36 0.23 1
All figures above 0.15 are significant at p = 0.05
All figures above 0.35 are significant at p <= 0.001
Table 12 C Results of one-way ANOVA: sales by level of education
Source of variation Sum of squares df Mean Square F Significance of F
Between groups 50.7 4 12.7 3.6 0.01
Within groups 501.8 145 3.5
Total 552.5 150
Table 12 D Results of regression Analysis
Multiple R 0.65924
R square 0.43459
Adjusted R square 0.35225
Standard error 0.41173
df 5.144 it's in open and closed brackets
F 5.27
Sig 0
Multiple R 0.65924
R Square 0.43459
Adjusted R Square 0.35225
Standard error 0.41173
df 5.144 it's in open and closed brackets
F 5.278
Sig 0
Variable Beta t Sig. t
Training of salesperson 0.28 2.768 0.0092
No. of salespersons 0.34 3.55 0.00001
Population 0.09 0.97 0.467
Per capita income 0.12 1.2 0.089
Advertisement 0.47 4.54 0.00001.
Purchase this Solution
Solution Summary
Your tutorial is 764 words and two references and is a letter to the CEO explaining each table and what it tells you. It also recommends what to do given all the table information.
Solution Preview
Dear CEO,
The tables A-D provided gives us an idea of how various variables (salesperson qualities, population, income and advertising) impact our sales based on a sample of 150 firms. Table A gives you the average (mean) for each of the variables as well as the standard deviation (average spread of sample data about the mean) and the range (minimum to maximum) for the sample data points. This gives you an idea of the firms in the sample, their average sales, average number of salespersons, average population for the sample firms, per capita income in the relevant market and the advertising expenditures. This tells you if the sample is similar or different from your firm and therefore if the results are likely to apply to you. It also gives you an idea of how similar or different these firms are from each other (small or large standard deviations).
In Table B the variables are correlated with each other. This means that you are seeing if they "move together" closely (strong relationship) or loosely (modest relationship) or not at all (no relationship). It shows that there is a strong relationship between sales and number of salespersons and a moderate relationship with the other three variables, population, income and ...
Education
- BSc, University of Virginia
- MSc, University of Virginia
- PhD, Georgia State University
Recent Feedback
- "hey just wanted to know if you used 0% for the risk free rate and if you didn't if you could adjust it please and thank you "
- "Thank, this is more clear to me now."
- "Awesome job! "
- "ty"
- "Great Analysis, thank you so much"
Purchase this Solution
Free BrainMass Quizzes
Paradigms and Frameworks of Management Research
This quiz evaluates your understanding of the paradigm-based and epistimological frameworks of research. It is intended for advanced students.
Marketing Research and Forecasting
The following quiz will assess your ability to identify steps in the marketing research process. Understanding this information will provide fundamental knowledge related to marketing research.
Basics of corporate finance
These questions will test you on your knowledge of finance.
Production and cost theory
Understanding production and cost phenomena will permit firms to make wise decisions concerning output volume.
Employee Orientation
Test your knowledge of employee orientation with this fun and informative quiz. This quiz is meant for beginner and advanced students as well as professionals already working in the HR field.