Risk Assessment and mitigation
Not what you're looking for?
1) A company's management team has done a risk assessment and identified ten risks to their operations. They have assigned significance and likelihood probabilities, identified the cost impact of incurring the risk, and the estimated the costs of installing preventive systems. The information is summarized in this table:
Identified Risk Significance Probability Likelihood Probability Cost impact Costs of installing preventive systems
A 0.40 0.35 10,000.00 30,000.00
B 0.23 0.90 12,000.00 44,000.00
C 0.88 0.30 2,000.00 1,500.00
D 0.14 0.70 30,000.00 45,000.00
E 0.30 0.80 23,000.00 11,000.00
F 0.77 0.80 20,000.00 42,000.00
G 0.21 0.18 20,000.00 22,000.00
H 0.95 0.77 50,000.00 65,000.00
I 0.90 0.95 48,000.00 10,000.00
J 0.70 0.43 78,000.00 7,000.00
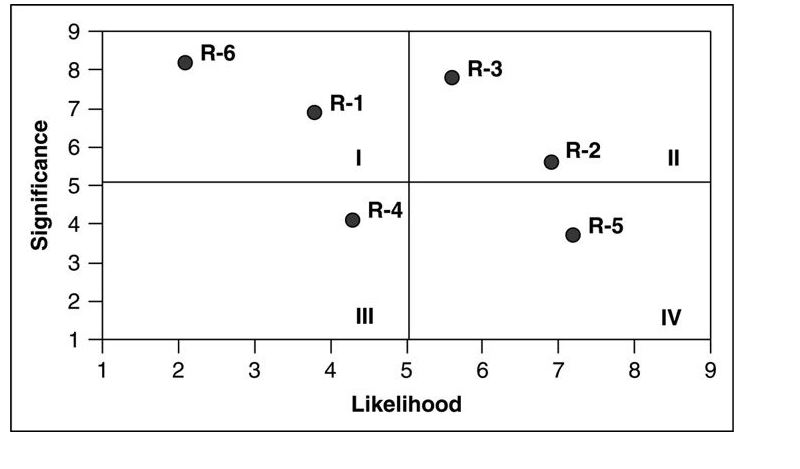
a. Create a Risk Assessment Analysis Chart for these risks, similar to the chart on page 31 in chapter 2 of your text. (See sample attached)
b. Rank these risks from 1 to 10 and calculate the Risk Score for each.
c. Considering the cost impacts and the costs of installing preventive systems, which risks should management ignore (take no action to manage), and which risks should they actively plan to manage (try to mitigate the risk)?
2) Controls mitigate risks. Risks involve both threats of bad things happening and threats of good things not happening. Some controls are visible and therefore can be photographed. Photograph four different controls you observe around a college campus or in your community. For each control photographed, indicate whether the control is designed to mitigate the threat of bad things happening or the threat of good things not happening. Briefly describe the objective the control is designed to achieve and the risk the control is designed to mitigate. If applicable, describe how the control is meant to operate and how you would test the control to determine if it is operating effectively.
Purchase this Solution
Solution Summary
Answered in 396 words. An Excel file with calculations and a Risk Assessment Analysis Chart is attached. A Word file with 4 photos and explanation of threats is attached.
Solution Preview
1a) Excel was used to create the chart. The Excel file is attached.
b) Risk Score = Significance X Likelihood
The calculations are shown in Excel.
The projects have been ranked from 1 to 10, based on the Risk Score. The highest Risk Score is ranked 1 while the lowest is ranked 10.
c) There are many ways to determine which risks management should ignore and which they should actively manager. One way is given below.
Perform a cost-benefit analysis. A new column named with costs has been created.
With costs = (Risk score) X (Cost impact) / (Cost of installing preventive systems)
The higher the ...
Education
- MSc, California State Polytechnic University, Pomona
- MBA, University of California, Riverside
- BSc, California State Polytechnic University, Pomona
- BSc, California State Polytechnic University, Pomona
Recent Feedback
- "Excellent work. Well explained."
- "Can you kindly take a look at 647530 and 647531. Thanks"
- "Thank you so very much. This is very well done and presented. I certainly appreciate your hard work. I am a novice at statistics and it is nice to know there are those out there who really do understand. Thanks again for an excellent posting. SPJ"
- "GREAT JOB!!!"
- "Hello, thank you for your answer for my probability question. However, I think you interpreted the second and third question differently than was meant, as the assumption still stands that a person still independently ranks the n options first. The probability I am after is the probability that this independently determined ranking then is equal to one of the p fixed rankings. Similarly for the third question, where the x people choose their ranking independently, and then I want the probability that for x people this is equal to one particular ranking. I was wondering if you could help me with this. "
Purchase this Solution
Free BrainMass Quizzes
Motivation
This tests some key elements of major motivation theories.
Lean your Process
This quiz will help you understand the basic concepts of Lean.
Team Development Strategies
This quiz will assess your knowledge of team-building processes, learning styles, and leadership methods. Team development is essential to creating and maintaining high performing teams.
Introduction to Finance
This quiz test introductory finance topics.
Six Sigma for Process Improvement
A high level understanding of Six Sigma and what it is all about. This just gives you a glimpse of Six Sigma which entails more in-depth knowledge of processes and techniques.