Statistics: Analysis of a Scatterplot
Not what you're looking for?
Please view the diagram in the attached file.
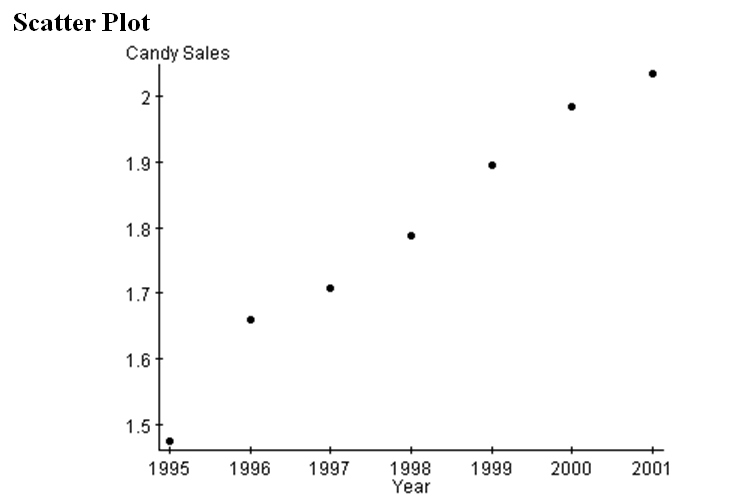
4. The following scatterplot shows the increase in Halloween candy sales (in millions of dollars) over a 7-year period.
Simple linear regression results:
Dependent Variable: Candy Sales
Independent Variable: Year
Candy Sales = -178.09921 + 0.090035714 Year
Sample size: 7
R (correlation coefficient) = 0.9875
R-sq = 0.9752395
Estimate of error standard deviation: 0.03394944
Parameter estimates:
Parameter Estimate
Intercept -178.09921
Slope 0.090035714
a. Looking at the scatterplot of the data, what does it tell you about the relationship between the year and the amount of candy sales?
b. Find the equation of the least squares line of regression.
c. What does the correlation coefficient tell you about the relationship between the year and the amount of candy sales?
d. Predict the amount of sales for 2002.
e. Are you confident that predictions based on the equation of the least squares line of regression will be quite accurate? Why or why not?
f. What percent of the variation in the amount of candy sales can be explained by the regression on (relationship with) the year?
Purchase this Solution
Solution Summary
Statistical analysis of a scatterplot is provided. Simple linear regression results are provided.
Solution Preview
a. There is a strong positive correlation between the two variables.
b. If year and candy sales are designated as x and y respectively, we could have the following equation: ...
Purchase this Solution
Free BrainMass Quizzes
Know Your Statistical Concepts
Each question is a choice-summary multiple choice question that presents you with a statistical concept and then 4 numbered statements. You must decide which (if any) of the numbered statements is/are true as they relate to the statistical concept.
Measures of Central Tendency
This quiz evaluates the students understanding of the measures of central tendency seen in statistics. This quiz is specifically designed to incorporate the measures of central tendency as they relate to psychological research.
Measures of Central Tendency
Tests knowledge of the three main measures of central tendency, including some simple calculation questions.
Terms and Definitions for Statistics
This quiz covers basic terms and definitions of statistics.