Statistics : Statistical Process Control
Not what you're looking for?
3. What is an example of a research problem at your organization that would benefit from the use of either descriptive statistics or probability distribution? Please provide a short background and how you would apply the concept.
5. Describe a possible application of Control Chart in your personal life. Please be specific about what data you will collect and the potential use of the Chart.
6. What are your views on Deming's point #11? Please support your views with a real world example
4. Define Chance variation and Assignable variation.
****Hypothesis Identification Article Analysis Paper****
Locate an article that pertains to a hypothesis that was used to validate a research study. Use "major databases" and the key search words "research studies in" to obtain an article. You can select communication, finance, economics, marketing, technology, or writing for the research study. Prepare a 450-550-word analysis of your selected article. Start by identifying the hypothesis described in the article, and explain how the hypothesis statement was used in the study. Be sure to properly cite your article.
****Please see attached files for Questions 2, 7, and 8*****
Purchase this Solution
Solution Summary
Artilcle, 1580 words report in APA format and excel file attached.
Solution Preview
Please see the attached files.
Statistics : Statistical Process Control
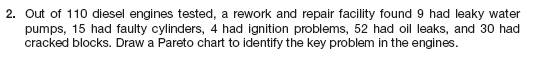
Question 2: Out of 110 diesel engine tested, a rework and repair facility found 9 had Leaky water pumps, 15 had faulty cylinders, 4 had ignition problems, 52 had oil leaks and 30 had cracked blocks. Draw a Pareto chart to identify the key problem in the engines.
Answer:
On the basis of the above chart, we can analyze that 47.27 % of defects are due to oil leakage and 27.28% of defects are due to cracked blocks. These two problems lead to 74.55% of the defects in the diesel engines.
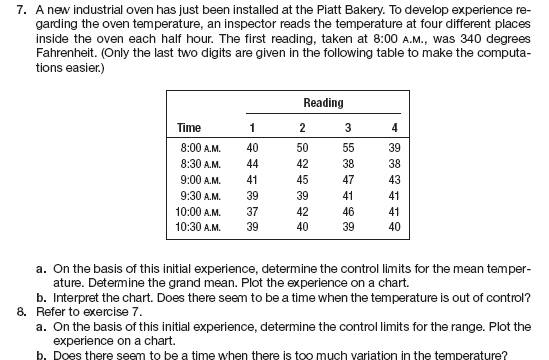
Question 7:
(a)
The mean temperature is 41.917 oF and the control limits for the mean temperature is 49.59oF-34.24oF.
(b)
The above chart shows the readings at four different places in the oven at different times. By analyzing the chart, we can say that there is an instance when temperature goes beyond control limits. At 8.00 A.M. at 3rd place temperature was 55oF which is beyond the control limit.
Question 8:
(a)
Control limit for the range is 0oF-15.2oF.
(b).
On the basis of the chart, we can say that at 8.00 A.M there are too many variations in the temperature.
Question 3:
What is an example of a research problem at your organization that would benefit from the use of either descriptive statistics or probability distribution? Please provide a short background and how you would apply the concept.
Answer 3:
At my organization, descriptive statistics will be helpful in identifying customer preferences i.e. problem of finding out what is more important to customers. Customer is the king of the market and for survival it becomes necessary for the organization to maintain its existing customers and to develop the new ones. The concept of descriptive statistics is applied by conducting a survey. For this purpose, goals and objectives must be defined. Once the objectives are defined in terms of resources and expertise the next step is to decide upon the budget and planning the schedule. Now the population is defined and sample is estimated. Thereafter, we have to decide upon the method of data collection. It depends upon the type of population to be surveyed, personnel available and the budget. Once the data is collected, the next step is to access the collected data.
Now before analyzing the data it become necessary to examine it i.e. to verify and clean it. After this, ...
Education
- MBA (IP), International Center for Internationa Business
- BBA, University of Rajasthan
Recent Feedback
- "Thank You so much! "
- "Always provide great help, I highly recommend Mr. Sharma over others, thanks again. "
- "great job. I will need another help from you. "
- "first class!"
- "Thank you for your great notes. Will you be willing to help me with one more assignment? "
Purchase this Solution
Free BrainMass Quizzes
Terms and Definitions for Statistics
This quiz covers basic terms and definitions of statistics.
Know Your Statistical Concepts
Each question is a choice-summary multiple choice question that presents you with a statistical concept and then 4 numbered statements. You must decide which (if any) of the numbered statements is/are true as they relate to the statistical concept.
Measures of Central Tendency
Tests knowledge of the three main measures of central tendency, including some simple calculation questions.
Measures of Central Tendency
This quiz evaluates the students understanding of the measures of central tendency seen in statistics. This quiz is specifically designed to incorporate the measures of central tendency as they relate to psychological research.