Normal Distribution and Verification of Data Distribution
Not what you're looking for?
Number Of Hours Of Television Watched
36.1 30.5 2.9 17.5 21.0
23.5 25.6 16.0 28.9 29.6
7.8 20.4 33.8 36.8 0.0
9.9 25.8 19.5 19.1 18.5
22.9 9.7 39.2 19.0 8.6
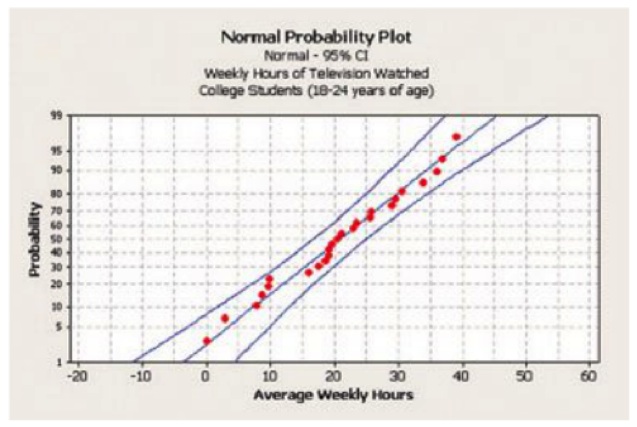
Using the following normal probability plot, determine if the data could have come from a normal distribution.
Normal Probability Chart
Determine the mean and standard deviation of the sample data.
Using the sample mean and sample standard deviation obtained in part b as estimates for the population mean and population standard deviation, respectively, draw a graph of a normal model for the distribution of weekly hours of television watched. Please attach it to your main post. (Hint: You can use http://davidmlane.com/hyperstat/z_table.html to create your graph; take a screenshot and attach it to your main post. You can also draw it out by hand, take a picture with your phone, and attach that image.)
Using the normal model from part (c), determine the proportion of college students aged 18 to 24 years who watch more than 40 hours of television per week (hint: use the website above to help you with this). Do you feel this is accurate? Why or why not?
Purchase this Solution
Solution Summary
The solution gives detailed steps on solving questions on the probabilities of normal distribution and verification of data distribution.
Purchase this Solution
Free BrainMass Quizzes
Know Your Statistical Concepts
Each question is a choice-summary multiple choice question that presents you with a statistical concept and then 4 numbered statements. You must decide which (if any) of the numbered statements is/are true as they relate to the statistical concept.
Measures of Central Tendency
This quiz evaluates the students understanding of the measures of central tendency seen in statistics. This quiz is specifically designed to incorporate the measures of central tendency as they relate to psychological research.
Terms and Definitions for Statistics
This quiz covers basic terms and definitions of statistics.
Measures of Central Tendency
Tests knowledge of the three main measures of central tendency, including some simple calculation questions.