Data on Women Swimmers
Not what you're looking for?
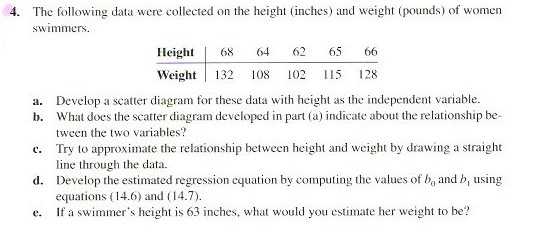
The following data was collected on height (inches) and weight (pounds) of women swimmers. See the attachment.
a. Develop a scatter diagram for these data with height as the independent variable.
B. What does the scatter diagram in part A indicate about the relations of the two variables?
C. Try to approximate the relationship between height and weight by drawing a straight line through the data.
D. Develop the estimated regression equation by computing the values of b(0) and b (2)using the equations (14.6) and (14.7).
E. If a swimmers height is 60 inches, what would you estimate her weight to be?
Questions also in attachment.
Purchase this Solution
Solution Summary
The solution answers questions on women swimmers including a scatter diagram.
Purchase this Solution
Free BrainMass Quizzes
Terms and Definitions for Statistics
This quiz covers basic terms and definitions of statistics.
Know Your Statistical Concepts
Each question is a choice-summary multiple choice question that presents you with a statistical concept and then 4 numbered statements. You must decide which (if any) of the numbered statements is/are true as they relate to the statistical concept.
Measures of Central Tendency
This quiz evaluates the students understanding of the measures of central tendency seen in statistics. This quiz is specifically designed to incorporate the measures of central tendency as they relate to psychological research.
Measures of Central Tendency
Tests knowledge of the three main measures of central tendency, including some simple calculation questions.