Explanation of ANOVA calculation
Not what you're looking for?
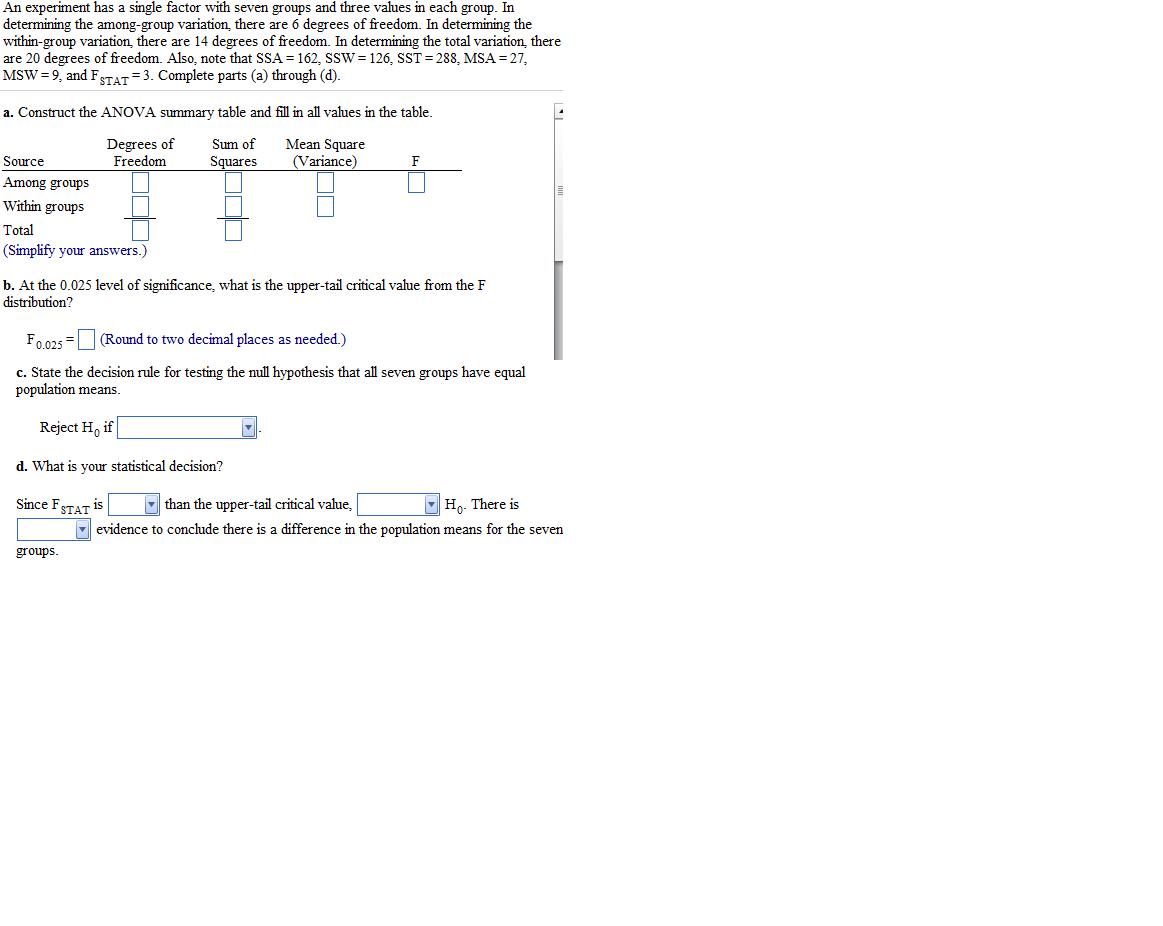
For the following ANOVA data, interpret the results with respect to mean values for each of the seven groups.
Source df SS MS F
Between 6 162 27 3
Within 14 126 9
Total 20 288
Purchase this Solution
Solution Summary
This solution provides assistance with calculating an ANOVA for the data provided.
Solution Preview
Hi there,
The following table is extremely helpful whenever you are looking to solve an ANOVA.
Source df SS MS F
Between 6 162 ...
Purchase this Solution
Free BrainMass Quizzes
Measures of Central Tendency
This quiz evaluates the students understanding of the measures of central tendency seen in statistics. This quiz is specifically designed to incorporate the measures of central tendency as they relate to psychological research.
Know Your Statistical Concepts
Each question is a choice-summary multiple choice question that presents you with a statistical concept and then 4 numbered statements. You must decide which (if any) of the numbered statements is/are true as they relate to the statistical concept.
Measures of Central Tendency
Tests knowledge of the three main measures of central tendency, including some simple calculation questions.
Terms and Definitions for Statistics
This quiz covers basic terms and definitions of statistics.