Plot graph corresponds
Not what you're looking for?
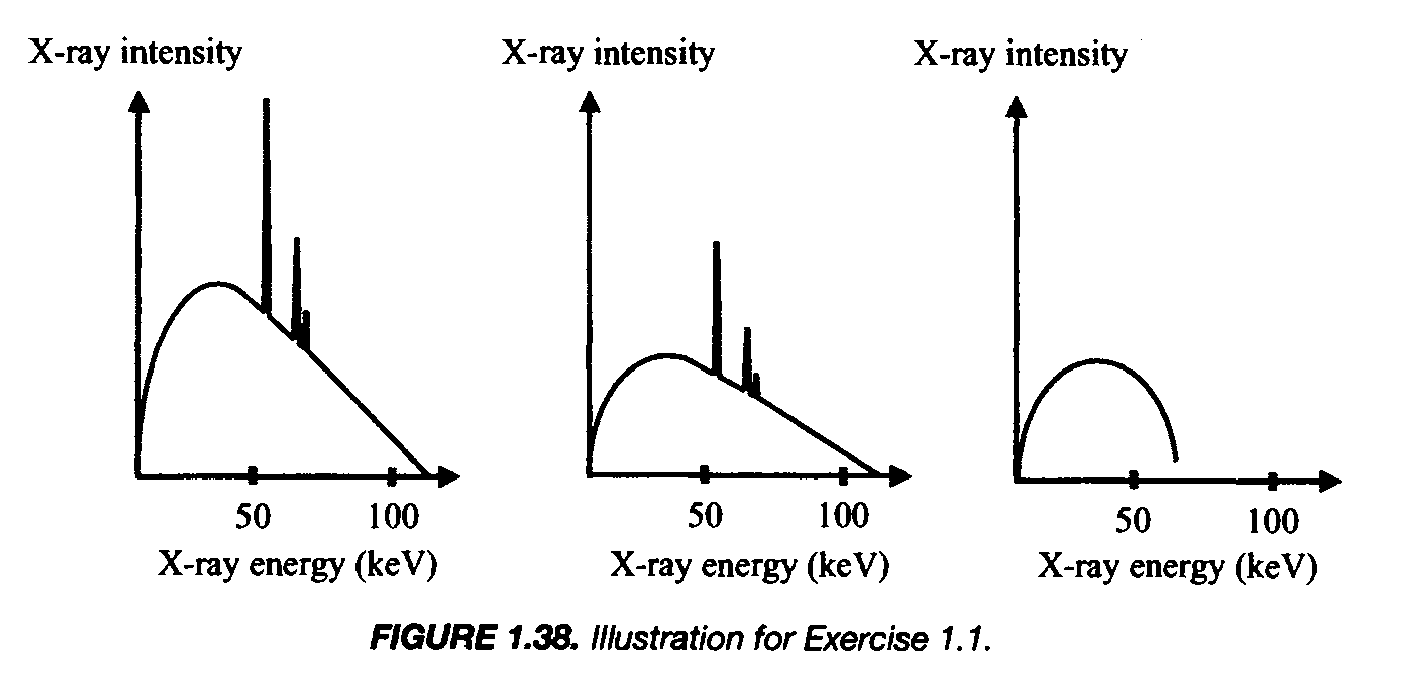
Figure 1.38 shows the intensity of X-rays produced from a source as a function of their energy. With respect to the reference graph shown on the left, one plot corresponds to a decrease in tube current and the other to a decrease in the accelerating voltage (kVp). Explain which plot corresponds to a decrease in which parameter.
The figure is in attached file.
Purchase this Solution
Solution Summary
The solution plots graph corresponds.
Solution Preview
The first thing we have to remember is that x-ray intensity is directly correlated with the quantity of x-rays produced, which is regulated by the amount of tube current available. Simply put, the less tube current, the less photons are produced and thus the less overall intensity.
The sharp peaks in the graphs are characteristic photons produced when electrons are ejected from orbit around the anode's elements, and another electron drops down one energy level. This releases a very specific photon with specific energy, based on what element the anode is made of. In ...
Purchase this Solution
Free BrainMass Quizzes
The Moon
Test your knowledge of moon phases and movement.
Variables in Science Experiments
How well do you understand variables? Test your knowledge of independent (manipulated), dependent (responding), and controlled variables with this 10 question quiz.
Basic Physics
This quiz will test your knowledge about basic Physics.
Classical Mechanics
This quiz is designed to test and improve your knowledge on Classical Mechanics.
Intro to the Physics Waves
Some short-answer questions involving the basic vocabulary of string, sound, and water waves.