Plot of the Fermi distribution function for different temperatures
Not what you're looking for?
plot the fermi distribution function at 200,300 and 400k(all on grah) and discuss the results in comparison to question 4.
http://lyle.smu.edu/ee/smuphotonics/Gain/CoursePresentationFall03/CarrierConcentration_0822.pdf
http://ecee.colorado.edu/~bart/book/distrib.htm (2.4.3)
these webs may help to plot the Fermi Function
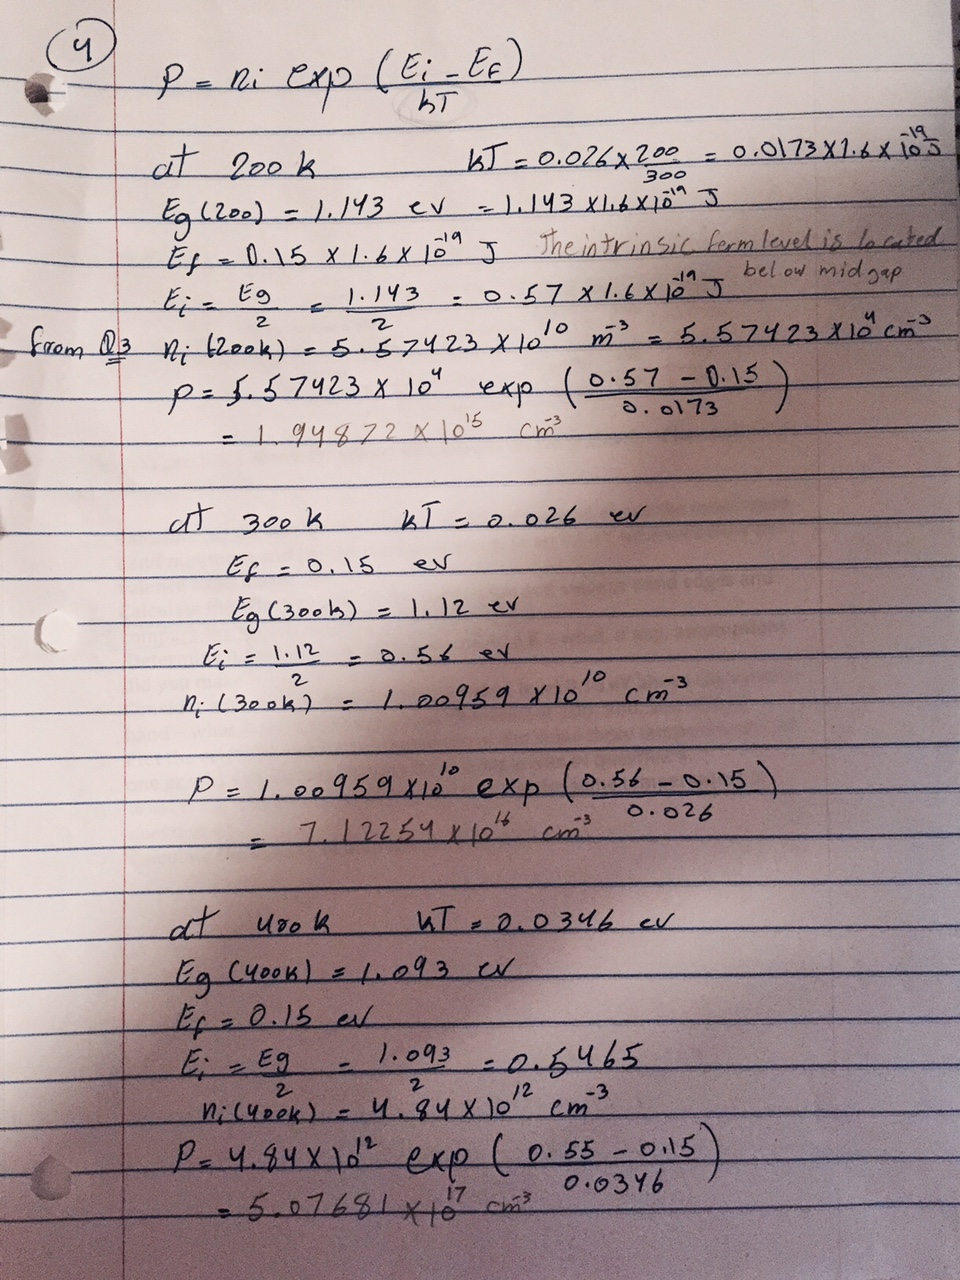
Also I attached answer of Q4 to comparison
NOTE, I would like use excel or Igor pro to plot
Purchase this Solution
Solution Summary
The problem was to plot Fermi distribution function for three different temperatures on one graph in Excel.
Solution Preview
Dear Student,
I am sending you plotted graphs of the Fermi distribution function at temperature 200 K, 300 K and 400 K.
Please if you have any questions, do not hesitate to ask me.
You calculated concentrations of the free holes for temperatures:
Clearly, concentration of the holes is increasing as the temperature is rising.
We have an example of p-type semiconductor where the charge carriers are holes. When we add some acceptor atom, the Fermi level will have lower energy with respect to the Fermi level of intrinsic semiconductor; it will be closer ...
Purchase this Solution
Free BrainMass Quizzes
The Moon
Test your knowledge of moon phases and movement.
Classical Mechanics
This quiz is designed to test and improve your knowledge on Classical Mechanics.
Intro to the Physics Waves
Some short-answer questions involving the basic vocabulary of string, sound, and water waves.
Basic Physics
This quiz will test your knowledge about basic Physics.
Introduction to Nanotechnology/Nanomaterials
This quiz is for any area of science. Test yourself to see what knowledge of nanotechnology you have. This content will also make you familiar with basic concepts of nanotechnology.