Analyzing graphs and finding derivatives
Not what you're looking for?
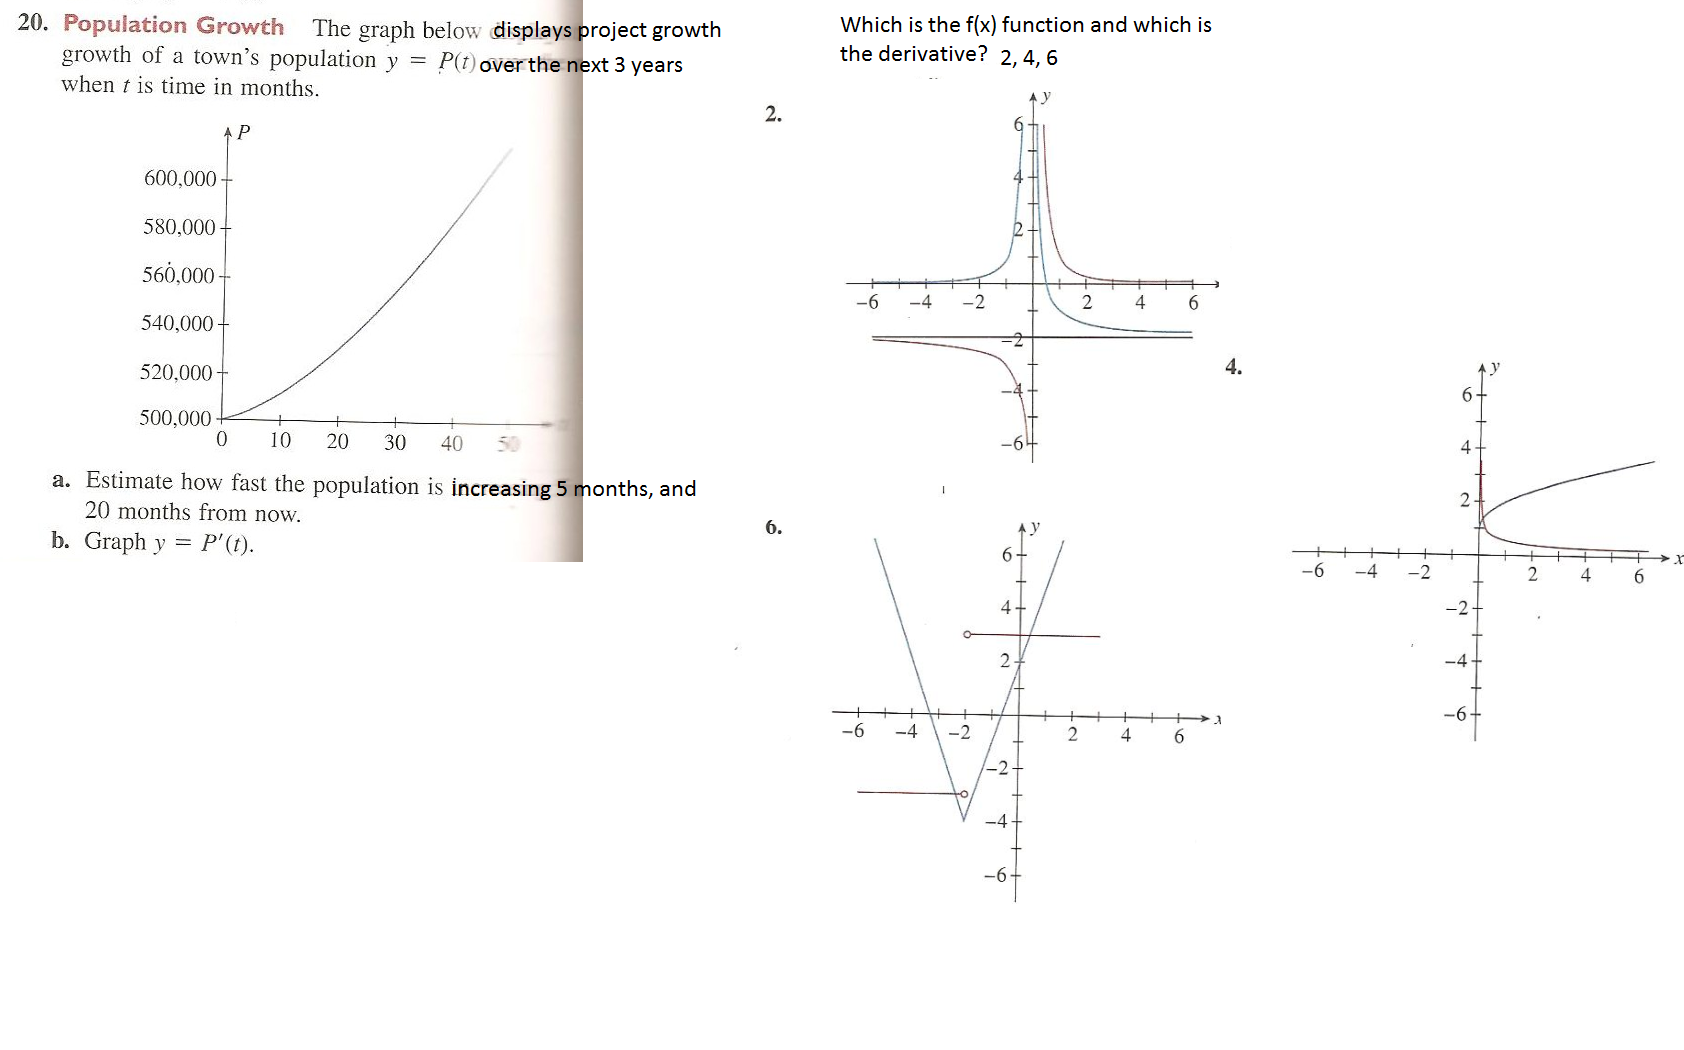
20. The graph below displays growth of a town's population y = P(t) over the next 3 years, where t is time in months.
a. Estimate how fast the population is increasing 5 months, and 20 months from now.
b. Graph y = P'(t).
In graphs of questions 2, 4 and 6, determine which is the f(x) function and which is the derivative?
Please see the attached document for graphs. Please explain your answer well i.e. how do you arrive at the answer/decision.
Purchase this Solution
Solution Summary
The process of analyzing the graph of a function to find its values and estimate the values of its derivative is illustrated with several examples. Examples of matching the graph f a function to the graph of its derivative are also given.
Solution Preview
20. The rate of change in the value of the function with respect to a change in the value of x is the derivative of the function. The derivative at a point is the slope of the tangent line to the graph of y=f(x) at that point. So, to estimate the growth rate 5 and 20 months from now, we need to estimate the slopes of the tangent lines to the given graph at x=5 and x=20. The first one ...
Purchase this Solution
Free BrainMass Quizzes
Exponential Expressions
In this quiz, you will have a chance to practice basic terminology of exponential expressions and how to evaluate them.
Solving quadratic inequalities
This quiz test you on how well you are familiar with solving quadratic inequalities.
Know Your Linear Equations
Each question is a choice-summary multiple choice question that will present you with a linear equation and then make 4 statements about that equation. You must determine which of the 4 statements are true (if any) in regards to the equation.
Probability Quiz
Some questions on probability
Multiplying Complex Numbers
This is a short quiz to check your understanding of multiplication of complex numbers in rectangular form.