Regression Analysis
Not what you're looking for?
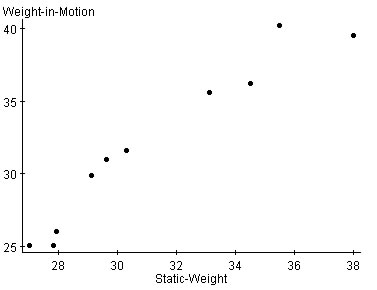
The Minnesota Department of Transportation hoped that they could measure the weights of big trucks without actually stopping the vehicles by using a newly developed "weight-in-motion" scale. To see if the new device was accurate, they conducted a calibration test. They weighed several trucks when stopped (static weight) assuming that this weight was correct. They the weighed the trucks while they were moving to see how well the new scale could estimate the actual weight.
Simple Linear Regression
Simple linear regression results:
Dependent Variable: Weight-in-Motion
Independent Variable: Static-Weight
Weight-in-Motion = -13.668853 + 1.460641 Static-Weight
Sample size: 10
R (correlation coefficient) = 0.9653
R-sq = 0.931764
Estimate of error standard deviation: 1.5751272
Parameter estimates:
Parameter Estimate
Intercept -13.668853
Slope 1.460641
a.Looking at the scatter plot of the data, what does it tell you about the relationship between the static weight and the "weight-in-motion"?
b.Find the equation of the least squares line of regression for this data.
c.What does the correlation coefficient tell you about the relationship between the static weight and the "weight-in-motion"?
d.Predict the "weight-in-motion" for a static weight of 32.
e.Are you confident that predictions based on the equation of this least squares line of regression will be quite accurate? Why or why not?
f.What percent of the variation in the "weight-in-motion" can be explained by the regression on (relationship with) the static weight?
Purchase this Solution
Solution Summary
Step by step method for regression analysis is discussed here. Regression coefficients, coefficient of determination, scatter diagram and significance of regression model are explained in the solution.
Purchase this Solution
Free BrainMass Quizzes
Measures of Central Tendency
Tests knowledge of the three main measures of central tendency, including some simple calculation questions.
Terms and Definitions for Statistics
This quiz covers basic terms and definitions of statistics.
Know Your Statistical Concepts
Each question is a choice-summary multiple choice question that presents you with a statistical concept and then 4 numbered statements. You must decide which (if any) of the numbered statements is/are true as they relate to the statistical concept.
Measures of Central Tendency
This quiz evaluates the students understanding of the measures of central tendency seen in statistics. This quiz is specifically designed to incorporate the measures of central tendency as they relate to psychological research.