Hypothesis Testing of a Random Sample Size of 64
Not what you're looking for?
See the attached file.
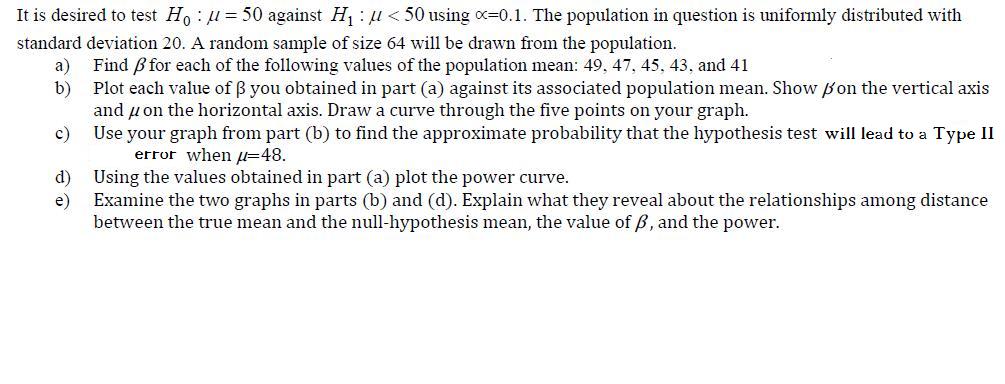
It is desired to test H0: u=50 against H1: u<50 using alpha=0.1. The population in question is uniformly distributed with standard deviation 20. A random sample of size 64 will be drawn from the population.
a) Find beta for each of the following values of the population mean: 49, 47, 45, 43 and 41
b) Plot each value of beta you obtained in part against its associated population mean. Show beta on the vertical axis and u on the horizontal axis. Draw a curve through the five points on your graph.
c) Use your graph from part (b) to find the approximate probability that the hypothesis test will lead to a type II error when u=48.
d) Using the values obtained in part (a) plot the power curve.
e) examine the two graphs in parts (b) and (d). Explain what they reveal about the relationship among distance between the true mean and the null hypothesis mean, the value beta, and the power.
Purchase this Solution
Solution Summary
This solution goes through various statistical concepts including means, null hypothesis, beta values and power.
Purchase this Solution
Free BrainMass Quizzes
Know Your Statistical Concepts
Each question is a choice-summary multiple choice question that presents you with a statistical concept and then 4 numbered statements. You must decide which (if any) of the numbered statements is/are true as they relate to the statistical concept.
Terms and Definitions for Statistics
This quiz covers basic terms and definitions of statistics.
Measures of Central Tendency
Tests knowledge of the three main measures of central tendency, including some simple calculation questions.
Measures of Central Tendency
This quiz evaluates the students understanding of the measures of central tendency seen in statistics. This quiz is specifically designed to incorporate the measures of central tendency as they relate to psychological research.