Conducting and Econometrics Analysis
Not what you're looking for?
Please see the attached file.
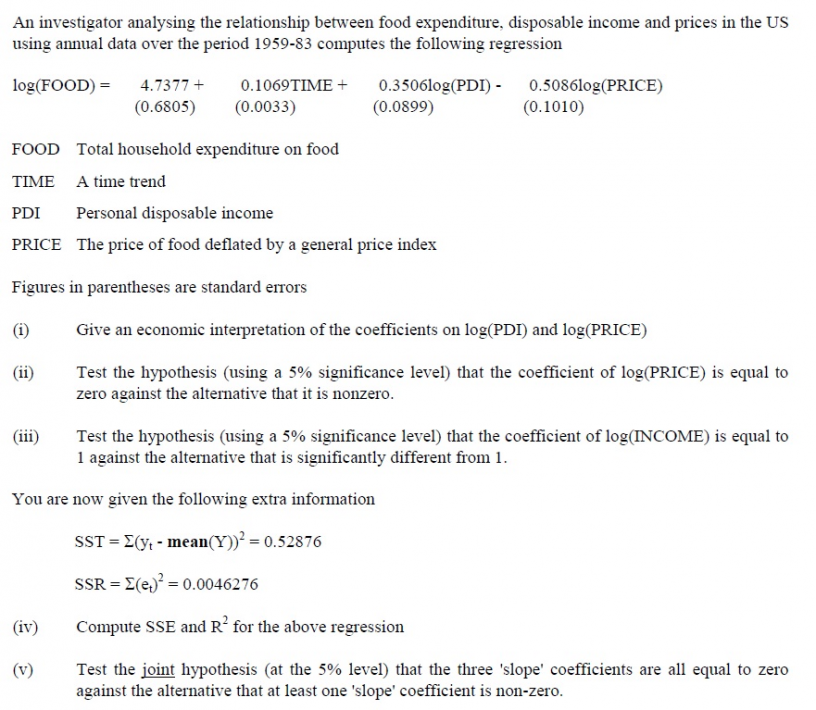
An investigator analysing the relationship between food expenditure, disposable income and prices in the US using annual data over the period 1959-83 computes the following regression
log(FOOD) = 4.7377 + 0.1069TIME + 0.3506log(PDI) - 0.5086log(PRICE)
(0.6805) (0.0033) (0.0899) (0.1010)
FOOD Total household expenditure on food
TIME A time trend
PDI Personal disposable income
PRICE The price of food deflated by a general price index
Figures in parentheses are standard errors
(i) Give an economic interpretation of the coefficients on log(PDI) and log(PRICE)
(ii) Test the hypothesis (using a 5% significance level) that the coefficient of log(PRICE) is equal to zero against the alternative that it is nonzero.
(iii) Test the hypothesis (using a 5% significance level) that the coefficient of log(INCOME) is equal to 1 against the alternative that is significantly different from 1.
You are now given the following extra information
SST = sum(y_t - mean(Y))^2 = 0.53876
SSR = sum(e_t)^2 = 0.0046276
(iv) Compute the SSE and R^2 for the above regression
(v) Test the joint hypothesis (at the 5% level) that the three 'slope' coefficients are all equal to zero against the alternative that at least one 'slope' coefficient is non-zero.
Purchase this Solution
Solution Summary
Going through the steps of hypothesis testing, this solution interprets the information in the regression, as well as calculates SSE and R squared. This solution is provided within a Word document which is attached.
Solution Preview
Please see the attached file.
Thanks for using BrainMass.
Solution.
(i) The coefficient on log(PDI) was 0.3506. It means that the elasticity was 0.3506. In other words, there is 35.06% change in Food for 1% change in PDI.
The coefficient on log(PRICE) was -0.5086. It means that the elasticity was
-0.5086. In other words, there is -50.86% change in Food for 1% change in PDI.
(ii) We conduct a t-test.
H0:
Ha:
We can compute the test statistic as follows. Given the standard error of the log(PRICE) to ...
Education
- BSc , Wuhan Univ. China
- MA, Shandong Univ.
Recent Feedback
- "Your solution, looks excellent. I recognize things from previous chapters. I have seen the standard deviation formula you used to get 5.154. I do understand the Central Limit Theorem needs the sample size (n) to be greater than 30, we have 100. I do understand the sample mean(s) of the population will follow a normal distribution, and that CLT states the sample mean of population is the population (mean), we have 143.74. But when and WHY do we use the standard deviation formula where you got 5.154. WHEN & Why use standard deviation of the sample mean. I don't understand, why don't we simply use the "100" I understand that standard deviation is the square root of variance. I do understand that the variance is the square of the differences of each sample data value minus the mean. But somehow, why not use 100, why use standard deviation of sample mean? Please help explain."
- "excellent work"
- "Thank you so much for all of your help!!! I will be posting another assignment. Please let me know (once posted), if the credits I'm offering is enough or you ! Thanks again!"
- "Thank you"
- "Thank you very much for your valuable time and assistance!"
Purchase this Solution
Free BrainMass Quizzes
Know Your Statistical Concepts
Each question is a choice-summary multiple choice question that presents you with a statistical concept and then 4 numbered statements. You must decide which (if any) of the numbered statements is/are true as they relate to the statistical concept.
Terms and Definitions for Statistics
This quiz covers basic terms and definitions of statistics.
Measures of Central Tendency
Tests knowledge of the three main measures of central tendency, including some simple calculation questions.
Measures of Central Tendency
This quiz evaluates the students understanding of the measures of central tendency seen in statistics. This quiz is specifically designed to incorporate the measures of central tendency as they relate to psychological research.