Statistics
Not what you're looking for?
Question 44: (2 points)
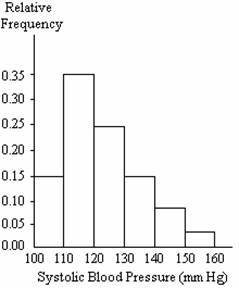
A nurse measured the blood pressure of each person who visited her clinic. Following is a relative-frequency histogram for the systolic blood pressure readings for those people aged between 25 and 40. Use the histogram to answer the question. The blood pressure readings were given to the nearest whole number.
* pic attached
Identify the center of the third class.
a. 125
b. 120
c. 130
d. 124
Question 46: (2 points)
Determine whether the given value is a statistic or a parameter.
After taking the first exam, 15 of the students dropped the class.
a. Parameter
b. Statistic
Perform the indicated goodness-of-fit test.
Using the data below and a 0.05 significance level, test the claim that the responses occur with percentages of 15%, 20%, 25%, 25%, and 15% respectively.
Response A B C D E
Frequency 12 15 16 18 19
a. Reject the null hypothesis. There is sufficient evidence to support the claim that the responses occur according to the stated percentages.
b. Reject the null hypothesis. There is sufficient evidence to warrant rejection of the claim that the responses occur according to the stated percentages.
c. Fail to reject the null hypothesis. There is not sufficient evidence to support the claim that the responses occur according to the stated percentages.
d. Fail to reject the null hypothesis. There is not sufficient evidence to warrant rejection of the claim that the responses occur according to the stated percentages.
'
Find the original data from the stem-and-leaf plot.
Stem Leaves
------------
7.4 1 8
7.5 8 9
7.6 1 9 9
a. 7.41, 7.48, 7.58, 7.59, 7.61, 7.69, 7.69
b. 0.84, 0.84. 1.55, 1.55, 1.65, 0.86, 1.66, 1.67
c. 7.41, 7.42, 7.58, 7.59, 7.65, 7.69, 7.69
d. 0.84, 1.54, 1.55, 1.65, 0.86, 1.66, 1.66
Find the value of the chi-square test statistic for the goodness-of-fit test.
According to recent research, the distribution of the number of children per family in the U.S. is as follows:
Number of children Percent
--------------------------------
More than 3 20.3
3 21.3
2 14.5
1 16.1
0 27.8
A random sample of 700 families with both parents under 40 yielded the following data:
Number of children Number of families
-----------------------------------------
More than 3 154
3 196
2 46
1 101
0 203
You wish to test the claim that the distribution of the number of children per family for families with both parents under 40 is the same as that of the U.S. as a whole. What is the value of the chi-square test statistic? (Note that expected frequencies are as follows: more than 3 children: 142.1; 3 children: 149.1; 2 children: 101.5; 1 child: 112.7; 0 children: 194.6.)
a. χ² = 32.091
b. χ² = 47.674
c. χ² = 13.781
d. χ² = 80.807
Purchase this Solution
Solution Summary
This solution is comprised of a detailed explanation to identify the center of the third class.
Education
- BSc , Wuhan Univ. China
- MA, Shandong Univ.
Recent Feedback
- "Your solution, looks excellent. I recognize things from previous chapters. I have seen the standard deviation formula you used to get 5.154. I do understand the Central Limit Theorem needs the sample size (n) to be greater than 30, we have 100. I do understand the sample mean(s) of the population will follow a normal distribution, and that CLT states the sample mean of population is the population (mean), we have 143.74. But when and WHY do we use the standard deviation formula where you got 5.154. WHEN & Why use standard deviation of the sample mean. I don't understand, why don't we simply use the "100" I understand that standard deviation is the square root of variance. I do understand that the variance is the square of the differences of each sample data value minus the mean. But somehow, why not use 100, why use standard deviation of sample mean? Please help explain."
- "excellent work"
- "Thank you so much for all of your help!!! I will be posting another assignment. Please let me know (once posted), if the credits I'm offering is enough or you ! Thanks again!"
- "Thank you"
- "Thank you very much for your valuable time and assistance!"
Purchase this Solution
Free BrainMass Quizzes
Know Your Statistical Concepts
Each question is a choice-summary multiple choice question that presents you with a statistical concept and then 4 numbered statements. You must decide which (if any) of the numbered statements is/are true as they relate to the statistical concept.
Measures of Central Tendency
Tests knowledge of the three main measures of central tendency, including some simple calculation questions.
Terms and Definitions for Statistics
This quiz covers basic terms and definitions of statistics.
Measures of Central Tendency
This quiz evaluates the students understanding of the measures of central tendency seen in statistics. This quiz is specifically designed to incorporate the measures of central tendency as they relate to psychological research.