Standard Deviation Example using Dogs and Exam Results
Not what you're looking for?
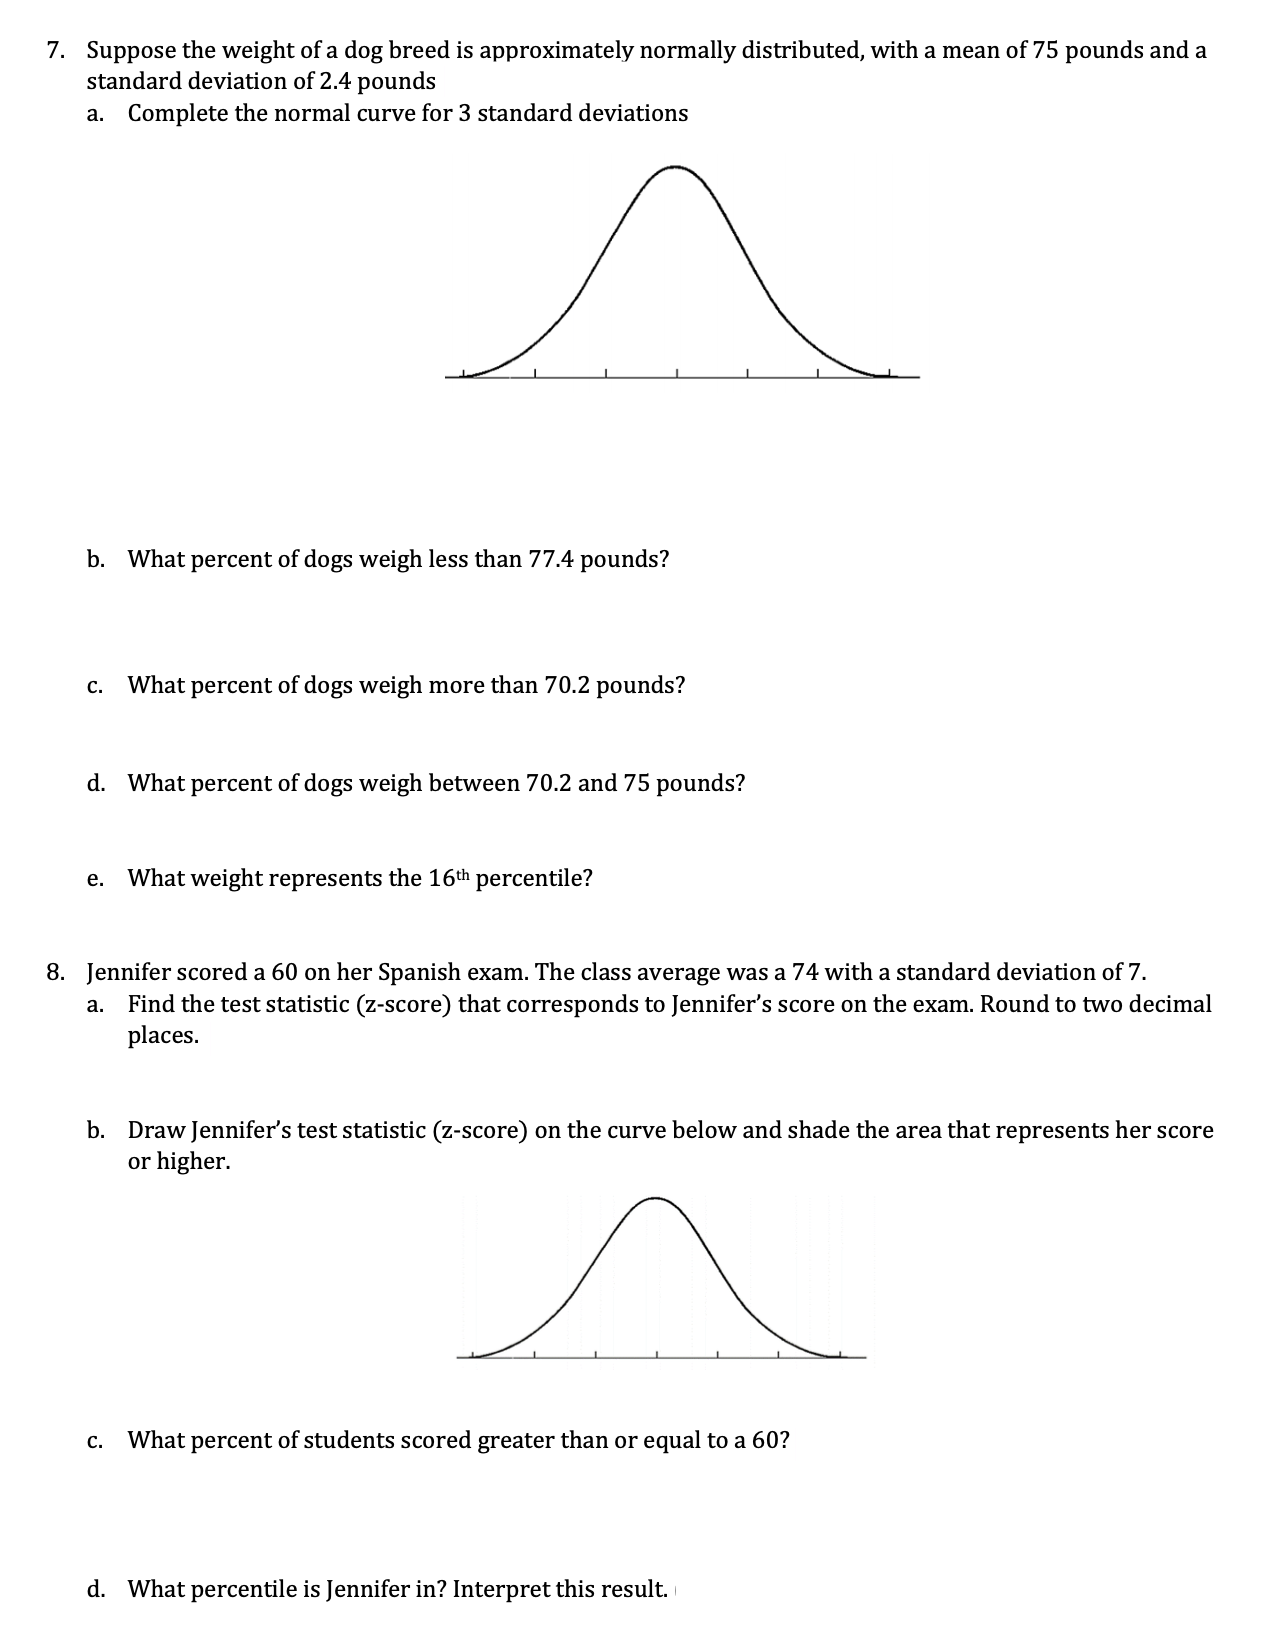
7. Suppose the weight of a dog breed is approximately normally distributed, with a mean of 75 pounds and a standard deviation of 2.4 pounds. Complete the normal curve for 3 standard deviations
b. What percent of dogs weigh less than 77.4 pounds?
c. What percent of dogs weigh more than 70.2 pounds?
d. What percent of dogs weigh between 70.2 and 75 pounds?
e. What weight represents the 16th percentile?
8. Jennifer scored a 60 on her Spanish exam. The class average was a 74 with a standard deviation of 7.
a. Find the test statistic (z-score) that corresponds to Jennifer's score on the exam. Round to tow decimal places.
b. Draw Jennifer's test statistic (z-score) on the curve below and shade the area that represents her score or higher.
c. What percent of students scored greater than or equal to a 60?
d. What percentile is Jennifer in? Interpret this result.
Purchase this Solution
Solution Summary
All solutions, graphs and computations are in the files attached using the examples of dog weights and exam results.
Education
- MSc, California State Polytechnic University, Pomona
- MBA, University of California, Riverside
- BSc, California State Polytechnic University, Pomona
- BSc, California State Polytechnic University, Pomona
Recent Feedback
- "Excellent work. Well explained."
- "Can you kindly take a look at 647530 and 647531. Thanks"
- "Thank you so very much. This is very well done and presented. I certainly appreciate your hard work. I am a novice at statistics and it is nice to know there are those out there who really do understand. Thanks again for an excellent posting. SPJ"
- "GREAT JOB!!!"
- "Hello, thank you for your answer for my probability question. However, I think you interpreted the second and third question differently than was meant, as the assumption still stands that a person still independently ranks the n options first. The probability I am after is the probability that this independently determined ranking then is equal to one of the p fixed rankings. Similarly for the third question, where the x people choose their ranking independently, and then I want the probability that for x people this is equal to one particular ranking. I was wondering if you could help me with this. "
Purchase this Solution
Free BrainMass Quizzes
Know Your Statistical Concepts
Each question is a choice-summary multiple choice question that presents you with a statistical concept and then 4 numbered statements. You must decide which (if any) of the numbered statements is/are true as they relate to the statistical concept.
Measures of Central Tendency
Tests knowledge of the three main measures of central tendency, including some simple calculation questions.
Terms and Definitions for Statistics
This quiz covers basic terms and definitions of statistics.
Measures of Central Tendency
This quiz evaluates the students understanding of the measures of central tendency seen in statistics. This quiz is specifically designed to incorporate the measures of central tendency as they relate to psychological research.