Compute the sample mean/standard deviation
Not what you're looking for?
NOTE: You may use MS Excel for this assignment to minimize time spent on it. Please show all the work unless stated otherwise.
1. Retrieve the CANSIM II data set with Vector V122497 taken from 2003/06/01 to 2008/05/31 from the CANSIM II website through library website. You should find 60 data points on the mortgage lending rate from June 2003 to May 2008. We will assume this dataset to be our population.
In a separate column, number the data from 00 to 59. Show a printout or a write-up of the dataset with column headings: "number" and "data". Is the data normally distributed? (Use two methods to determine normality and comment on your results). (20 points)
2. Take a sample of size n=31 from this data set (the population). We don't care how you take this sample so long as you DON'T use a formula or a methodical process for it . Show the data points of the sample. (10 points)
3. (10 points) Go to this website http://www.random.org/integers/
Generate 31 random numbers, from integer values of 0 to 59, recorded in "1" column as requested on the site. Match the random numbers with the "number" column of your population data from Question 1 and record the corresponding "data" points to get your new random sample of 31 data points. A random number repeated twice means you pick the data point twice. Show the random numbers and data points for your new sample.
4. For the following questions, 4i & 4ii, you can show just formulae and final answer. (20 points)
i. Compute the sample statistics; xbar(sample mean) and s (sample standard deviation), for the samples in Question 2 and Question 3.
ii. Find population parameters; μ (population mean) and σ (population standard deviation)
iii. Compare the means and standard deviations from Questions 4i and 4ii. Are these statistics different? What concepts we learned in class can be used to explain the differences, if any.
5. (20 points)
i. Given the population parameters computed in 4ii, what is the probability that if a mortgage lending rate is randomly selected, it will lie above μ+2σ of the population mean?
ii. Again, given these population parameters, what is the probability that for a sample of 35 mortgage lending rates, the mean will lie above μ+2σ of the population mean? You don't need to actually take a sample of 35. Explain why this is the case.
iii. Compare the results in 5i. and 5ii. What concepts we learned in class can theoretically drive these results? Note and explain key concepts.
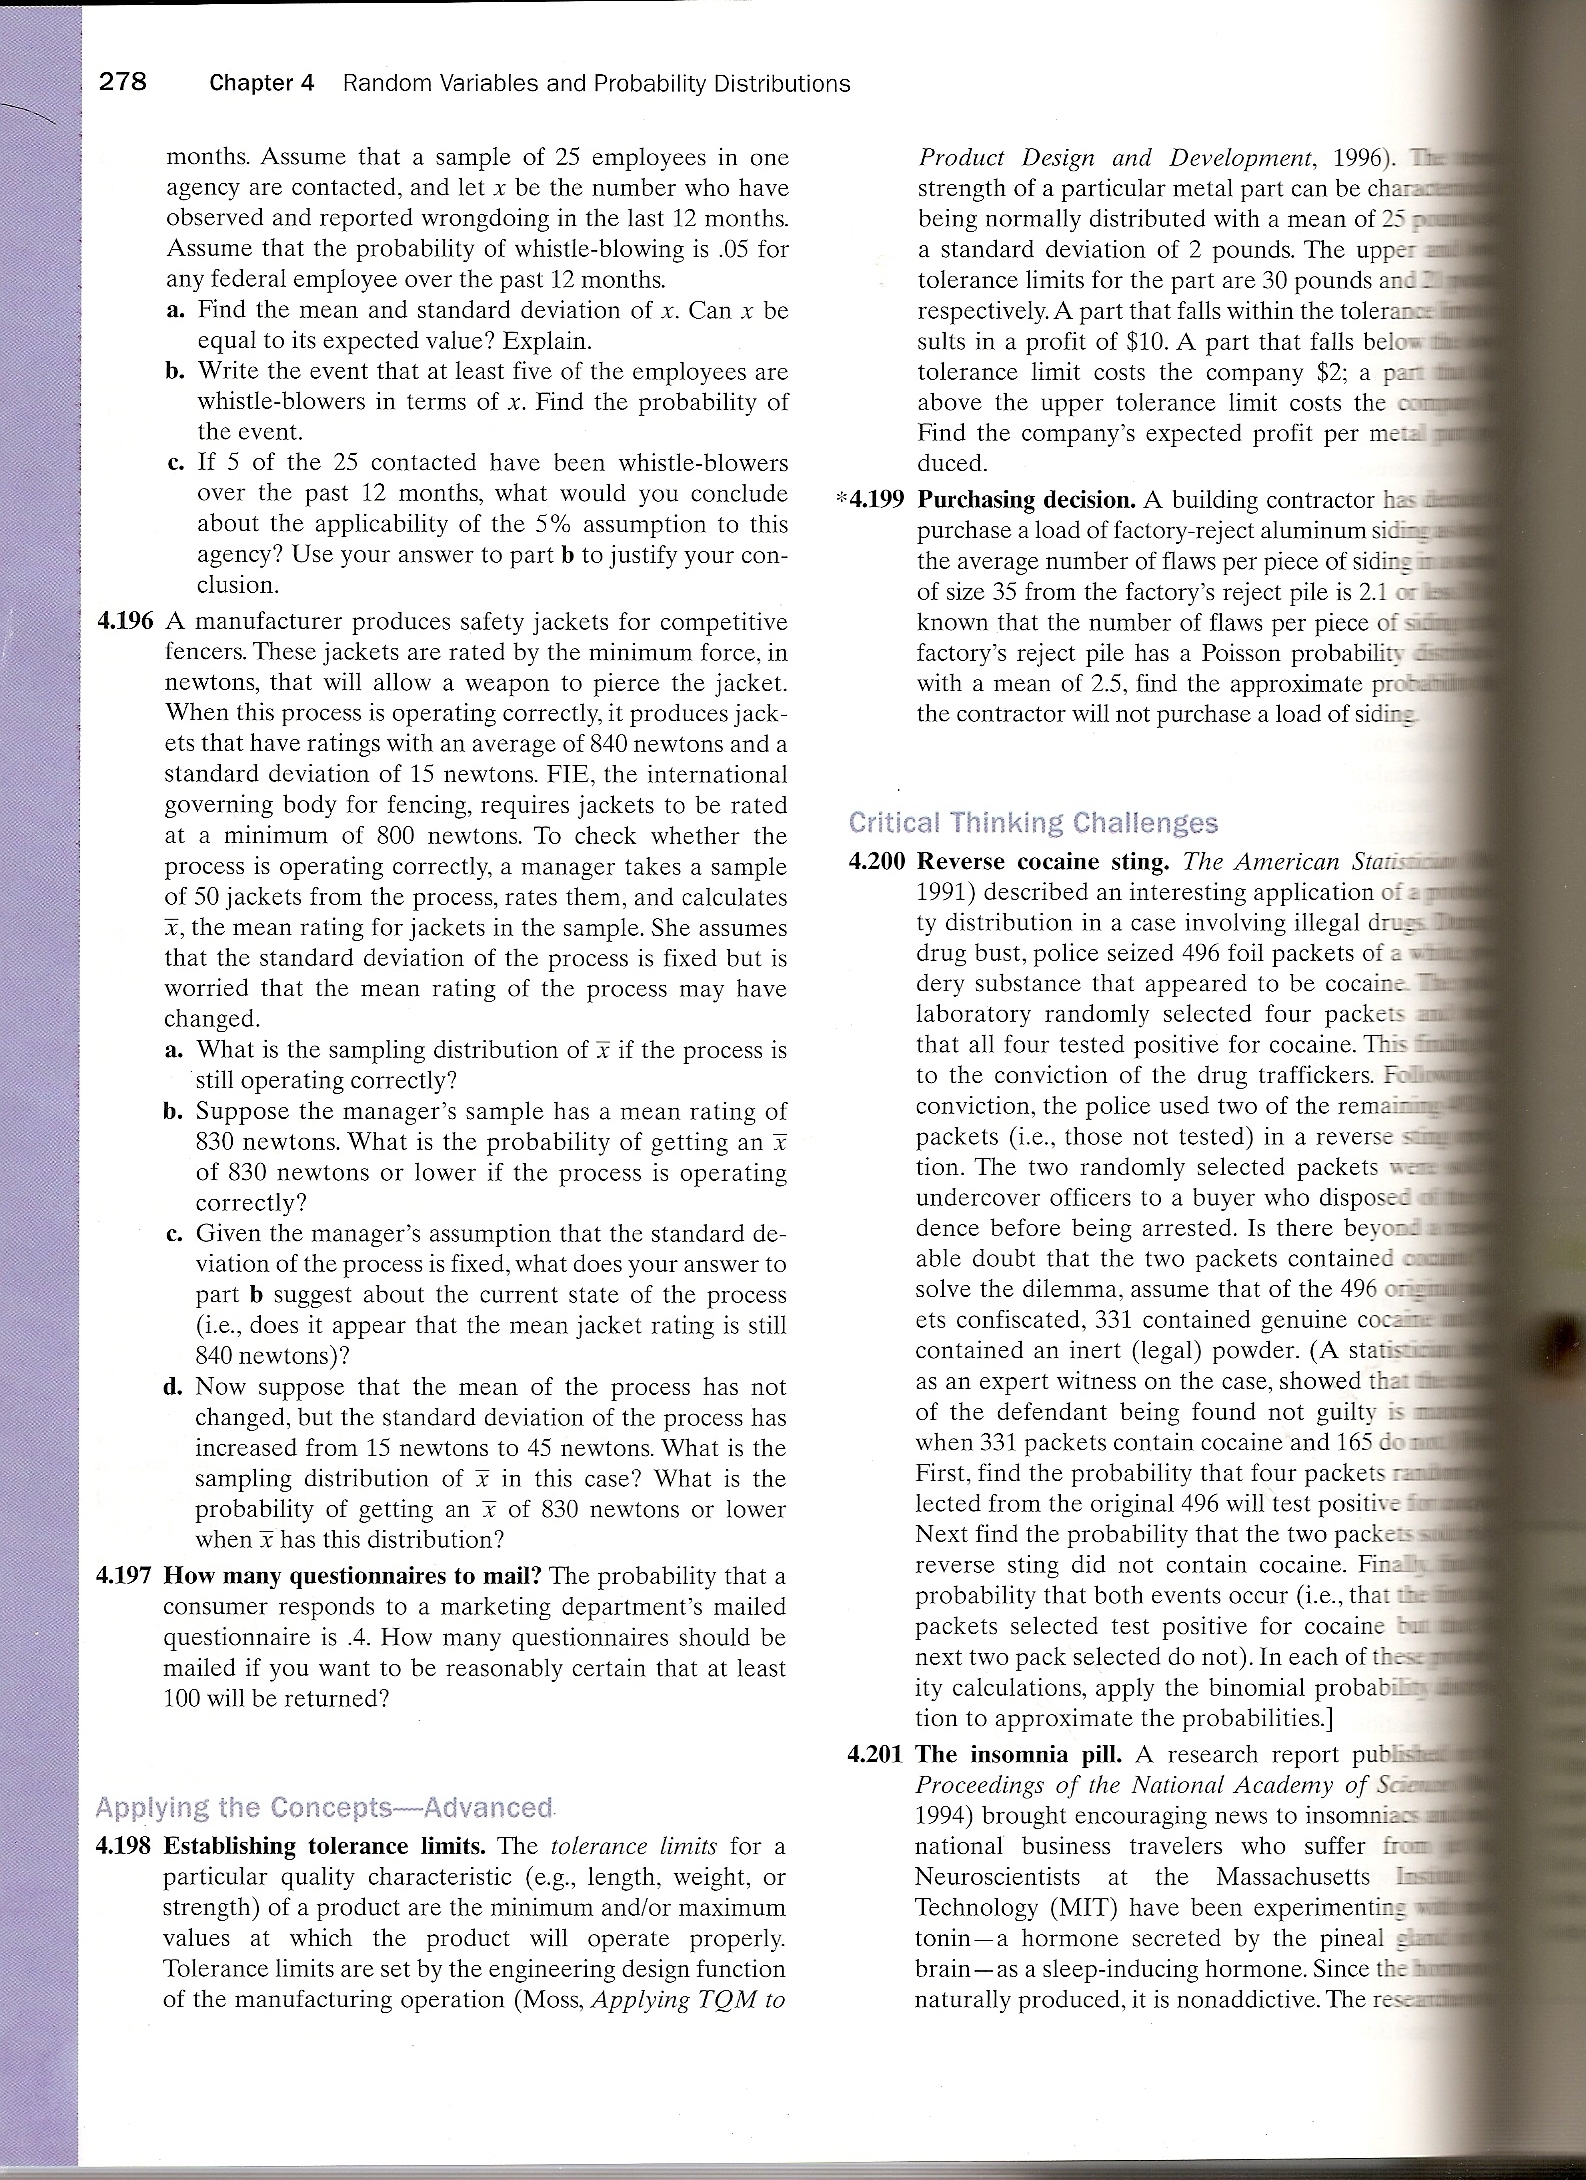
6. Exercise 4.196 from the text (on page278 of the 10th edition) (20 points)
Purchase this Solution
Purchase this Solution
Free BrainMass Quizzes
Measures of Central Tendency
This quiz evaluates the students understanding of the measures of central tendency seen in statistics. This quiz is specifically designed to incorporate the measures of central tendency as they relate to psychological research.
Know Your Statistical Concepts
Each question is a choice-summary multiple choice question that presents you with a statistical concept and then 4 numbered statements. You must decide which (if any) of the numbered statements is/are true as they relate to the statistical concept.
Terms and Definitions for Statistics
This quiz covers basic terms and definitions of statistics.
Measures of Central Tendency
Tests knowledge of the three main measures of central tendency, including some simple calculation questions.