Descriptive Statistic Calculations
Not what you're looking for?
1. Heights of men on a baseball team have a bell shaped distrubtion with a mean of 172cm and a standard deviation of 7cm. Using that is the empirical rule, what is the approximate percentage of the men between the following values?
a) 165 cm and 179cm
b) 151cm and 193cm
2. Heights of women have a bell shaped distribution with a mean of 161cm and a standard deviation of 6cm. Using Chebyshev's theorem, what do we know about the percentage of women with heights that are within 2 standard deviations of the mean? What are the minimum and maximum heights that are within 2 standard deviations of the mean?
3. Suppose a baseball player had 208 hits in a season. In the given probability distrubtion, the random variable x represents the number of hits the player obtained in a game.
X 0 1 2 3 4 5
P(x) 0.1134 0.4724 0.2734 0.0638 0.0367 0.0403
a) Compute and interpret the mean of the random variable x.
µᵪ=_____
4. Assume that a prodcure yields a binomial distrubtion with a trail repeated n times. Use a binomial probabilities table to find the probability of x successes given the probability p of success on a given trail.
n=2, x=2, p=0.70
P(2)=_____
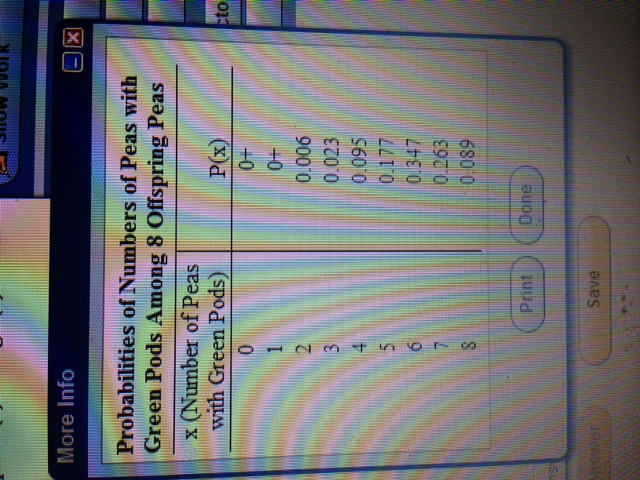
5. The accompanying table describes results from eight offspring peas. The random x represents the number of offspring peas with green pods.
a) Find the probability of getting exactly 7 peas with green pods. (file attached)
Purchase this Solution
Solution Summary
The solution gived detailed steps on answering various question about descriptive statistics. All formula and calcuations are shown and explained.
Solution Preview
1. Heights of men on a baseball team have a bell shaped distrubtion with a mean of 172cm and a standard deviation of 7cm. Using that is the empirical rule, what is the approximate percentage of the men between the following values?
a) 165 cm and 179cm
b) 151cm and 193cm
c)
Ans a): By empirical rule, since 179-172=172-165=7=1 standard deviation, percentage of mean between 165 and 179 is 65%.
b): By empirical rule, since 193-172=172-151=21=3 standard deviation, percentage of mean between 165 and 179 ...
Purchase this Solution
Free BrainMass Quizzes
Measures of Central Tendency
This quiz evaluates the students understanding of the measures of central tendency seen in statistics. This quiz is specifically designed to incorporate the measures of central tendency as they relate to psychological research.
Know Your Statistical Concepts
Each question is a choice-summary multiple choice question that presents you with a statistical concept and then 4 numbered statements. You must decide which (if any) of the numbered statements is/are true as they relate to the statistical concept.
Measures of Central Tendency
Tests knowledge of the three main measures of central tendency, including some simple calculation questions.
Terms and Definitions for Statistics
This quiz covers basic terms and definitions of statistics.