Boxplot of Random Samples
Not what you're looking for?
I need some help with these two questions, please show step-by-step with a box plot. Thank you in advance:
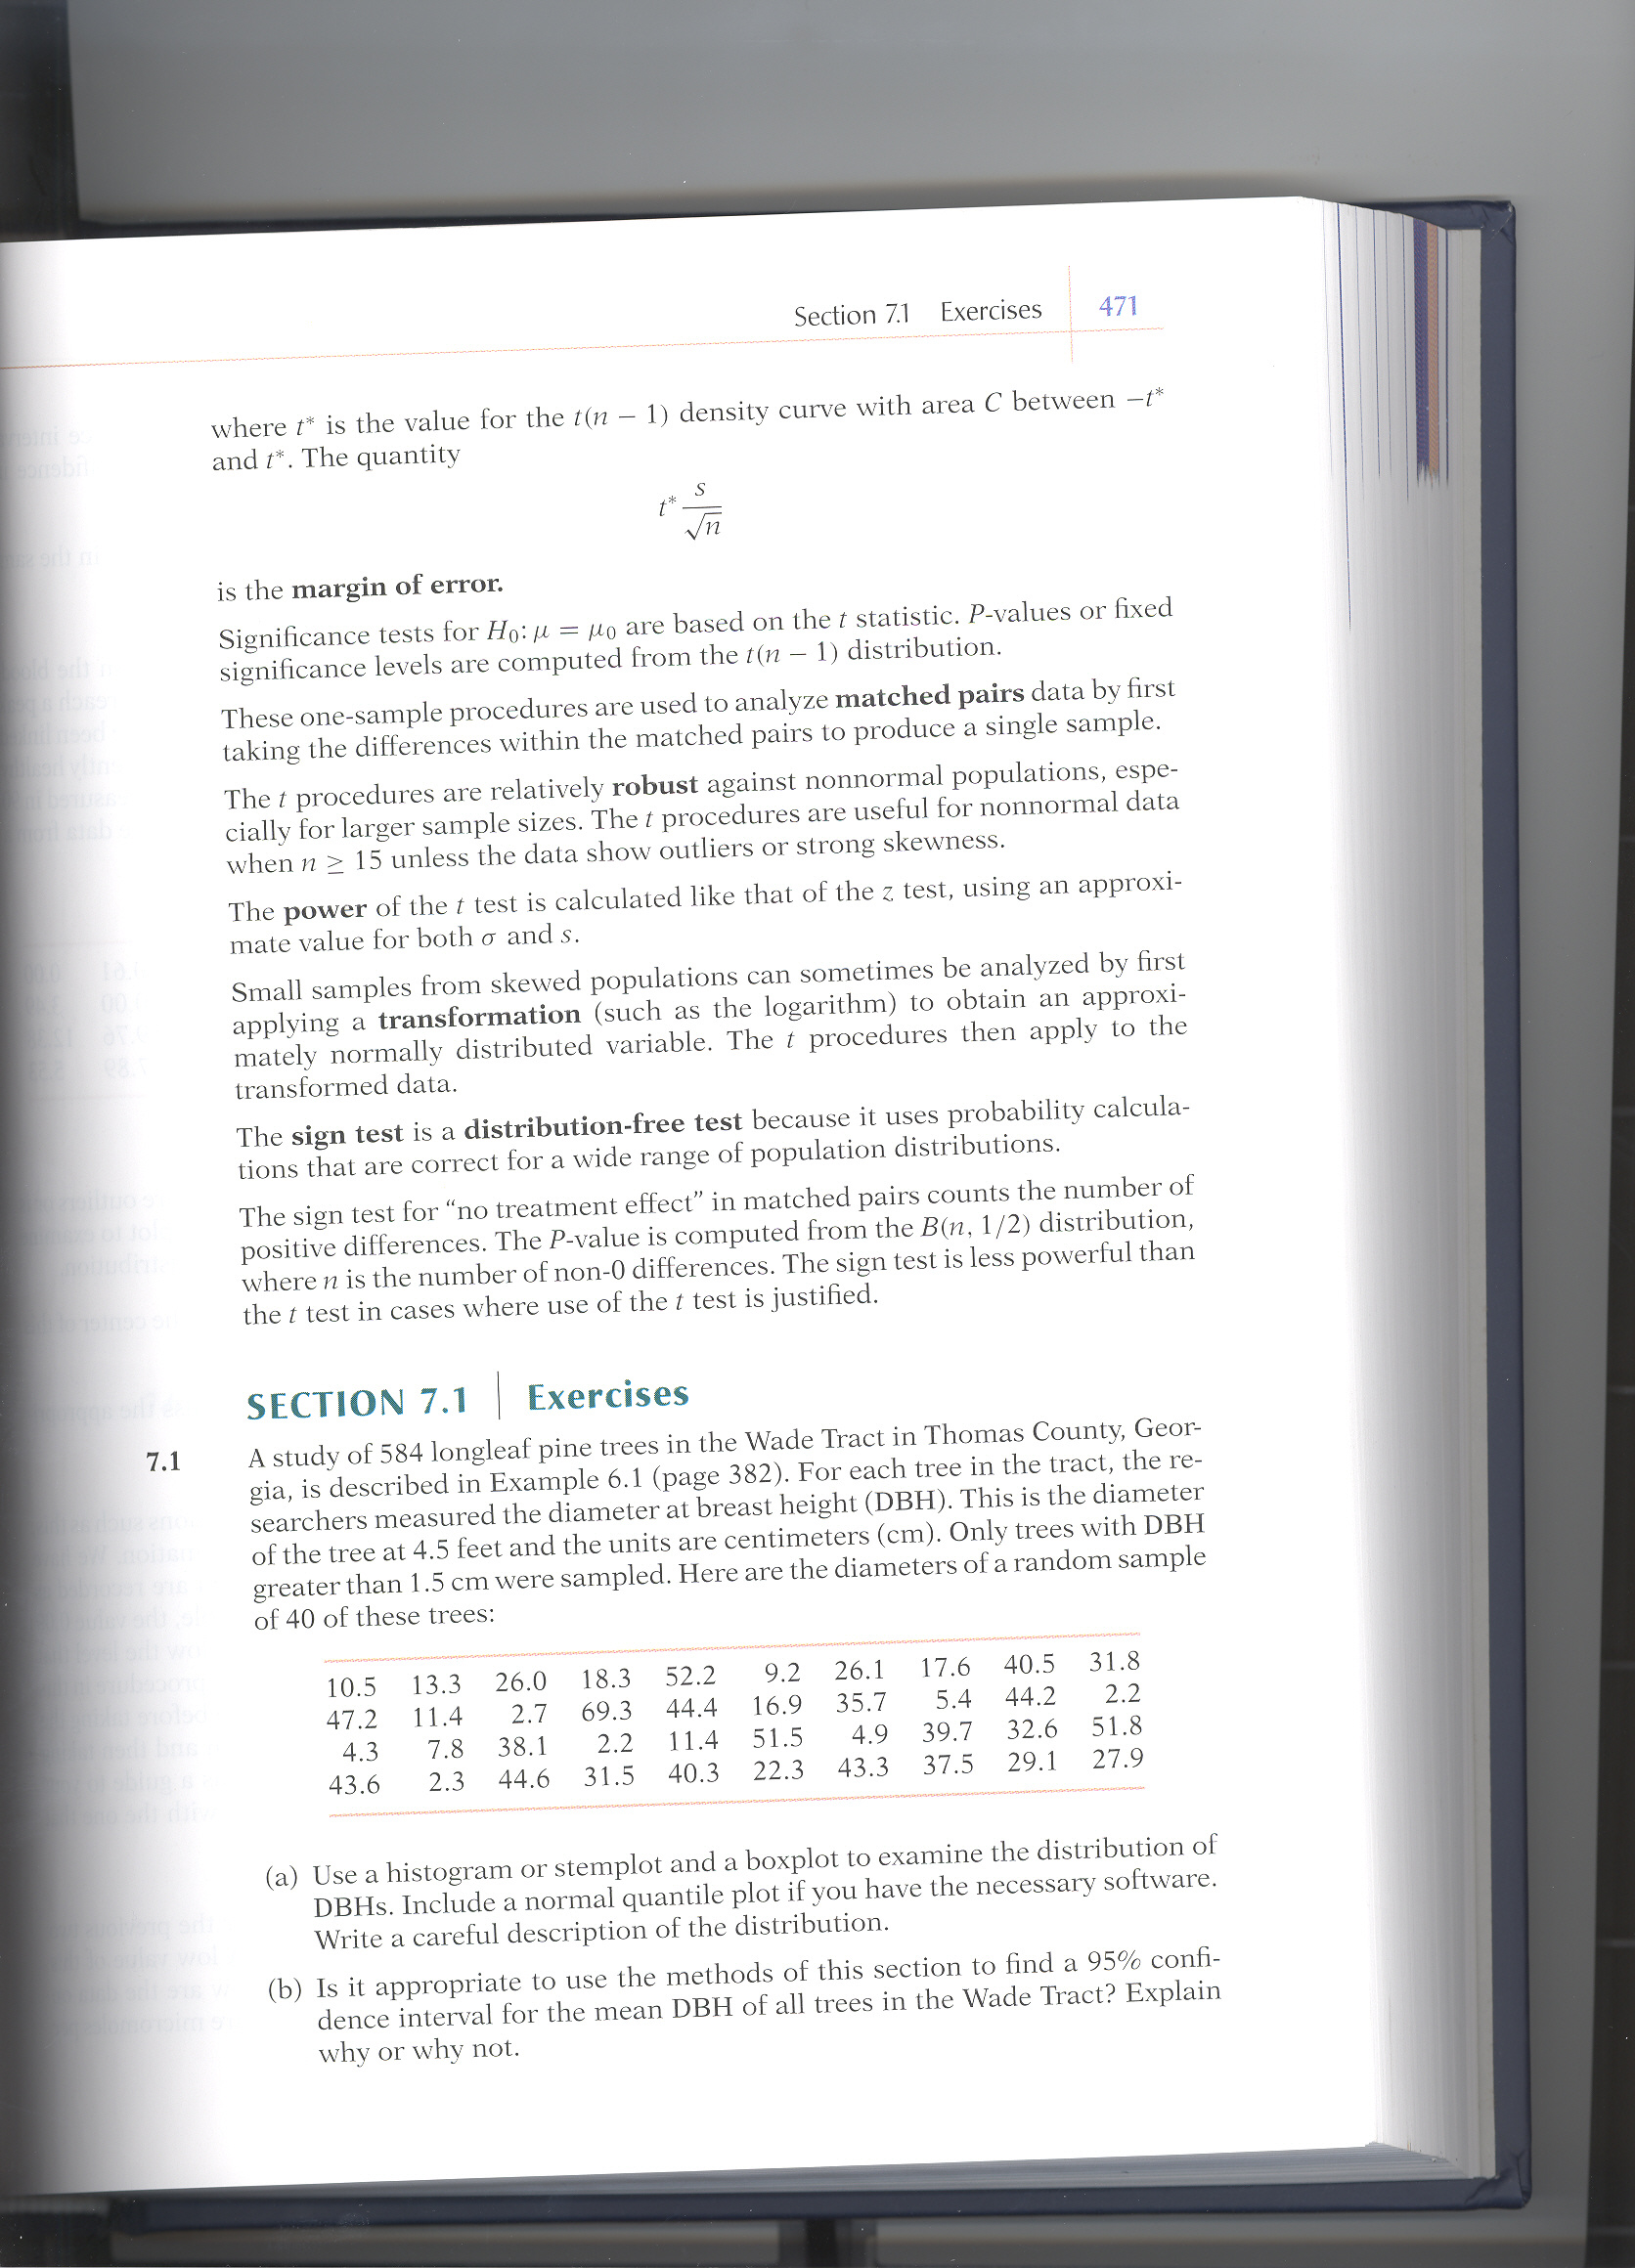
7.1. A study of 584 longleaf pine trees in the Wade Tract in Thomas County, Georgia is described in example 6.1. For each tree in the tract, the researchers measured the diameter at breast height (DBH). This is the diameter of the tree at 4.5 feet and the units are centimeters (cm). Only trees with DBH greater than 1.5cm were sampled. Here are the diameters of a random sample of 40 of these trees: (see attachment).
a. Use a histogram or stemplot and a boxplot to examine the distribution of DBHs. Include a normal quantile plot if you have the necessary software. Write a careful description of the distribution.
b. Is it appropriate to use the methods of this section to find a 95% confidence interval for the mean DBH of all trees in the Wade Tract? Explain why or why not.
c. Report the mean with the margin of error and the confidence interval. Write a short summary describing the meaning of the confidence interval.
d. Do you think these results would apply to other similar trees in the same area? Give reasons for your answer.
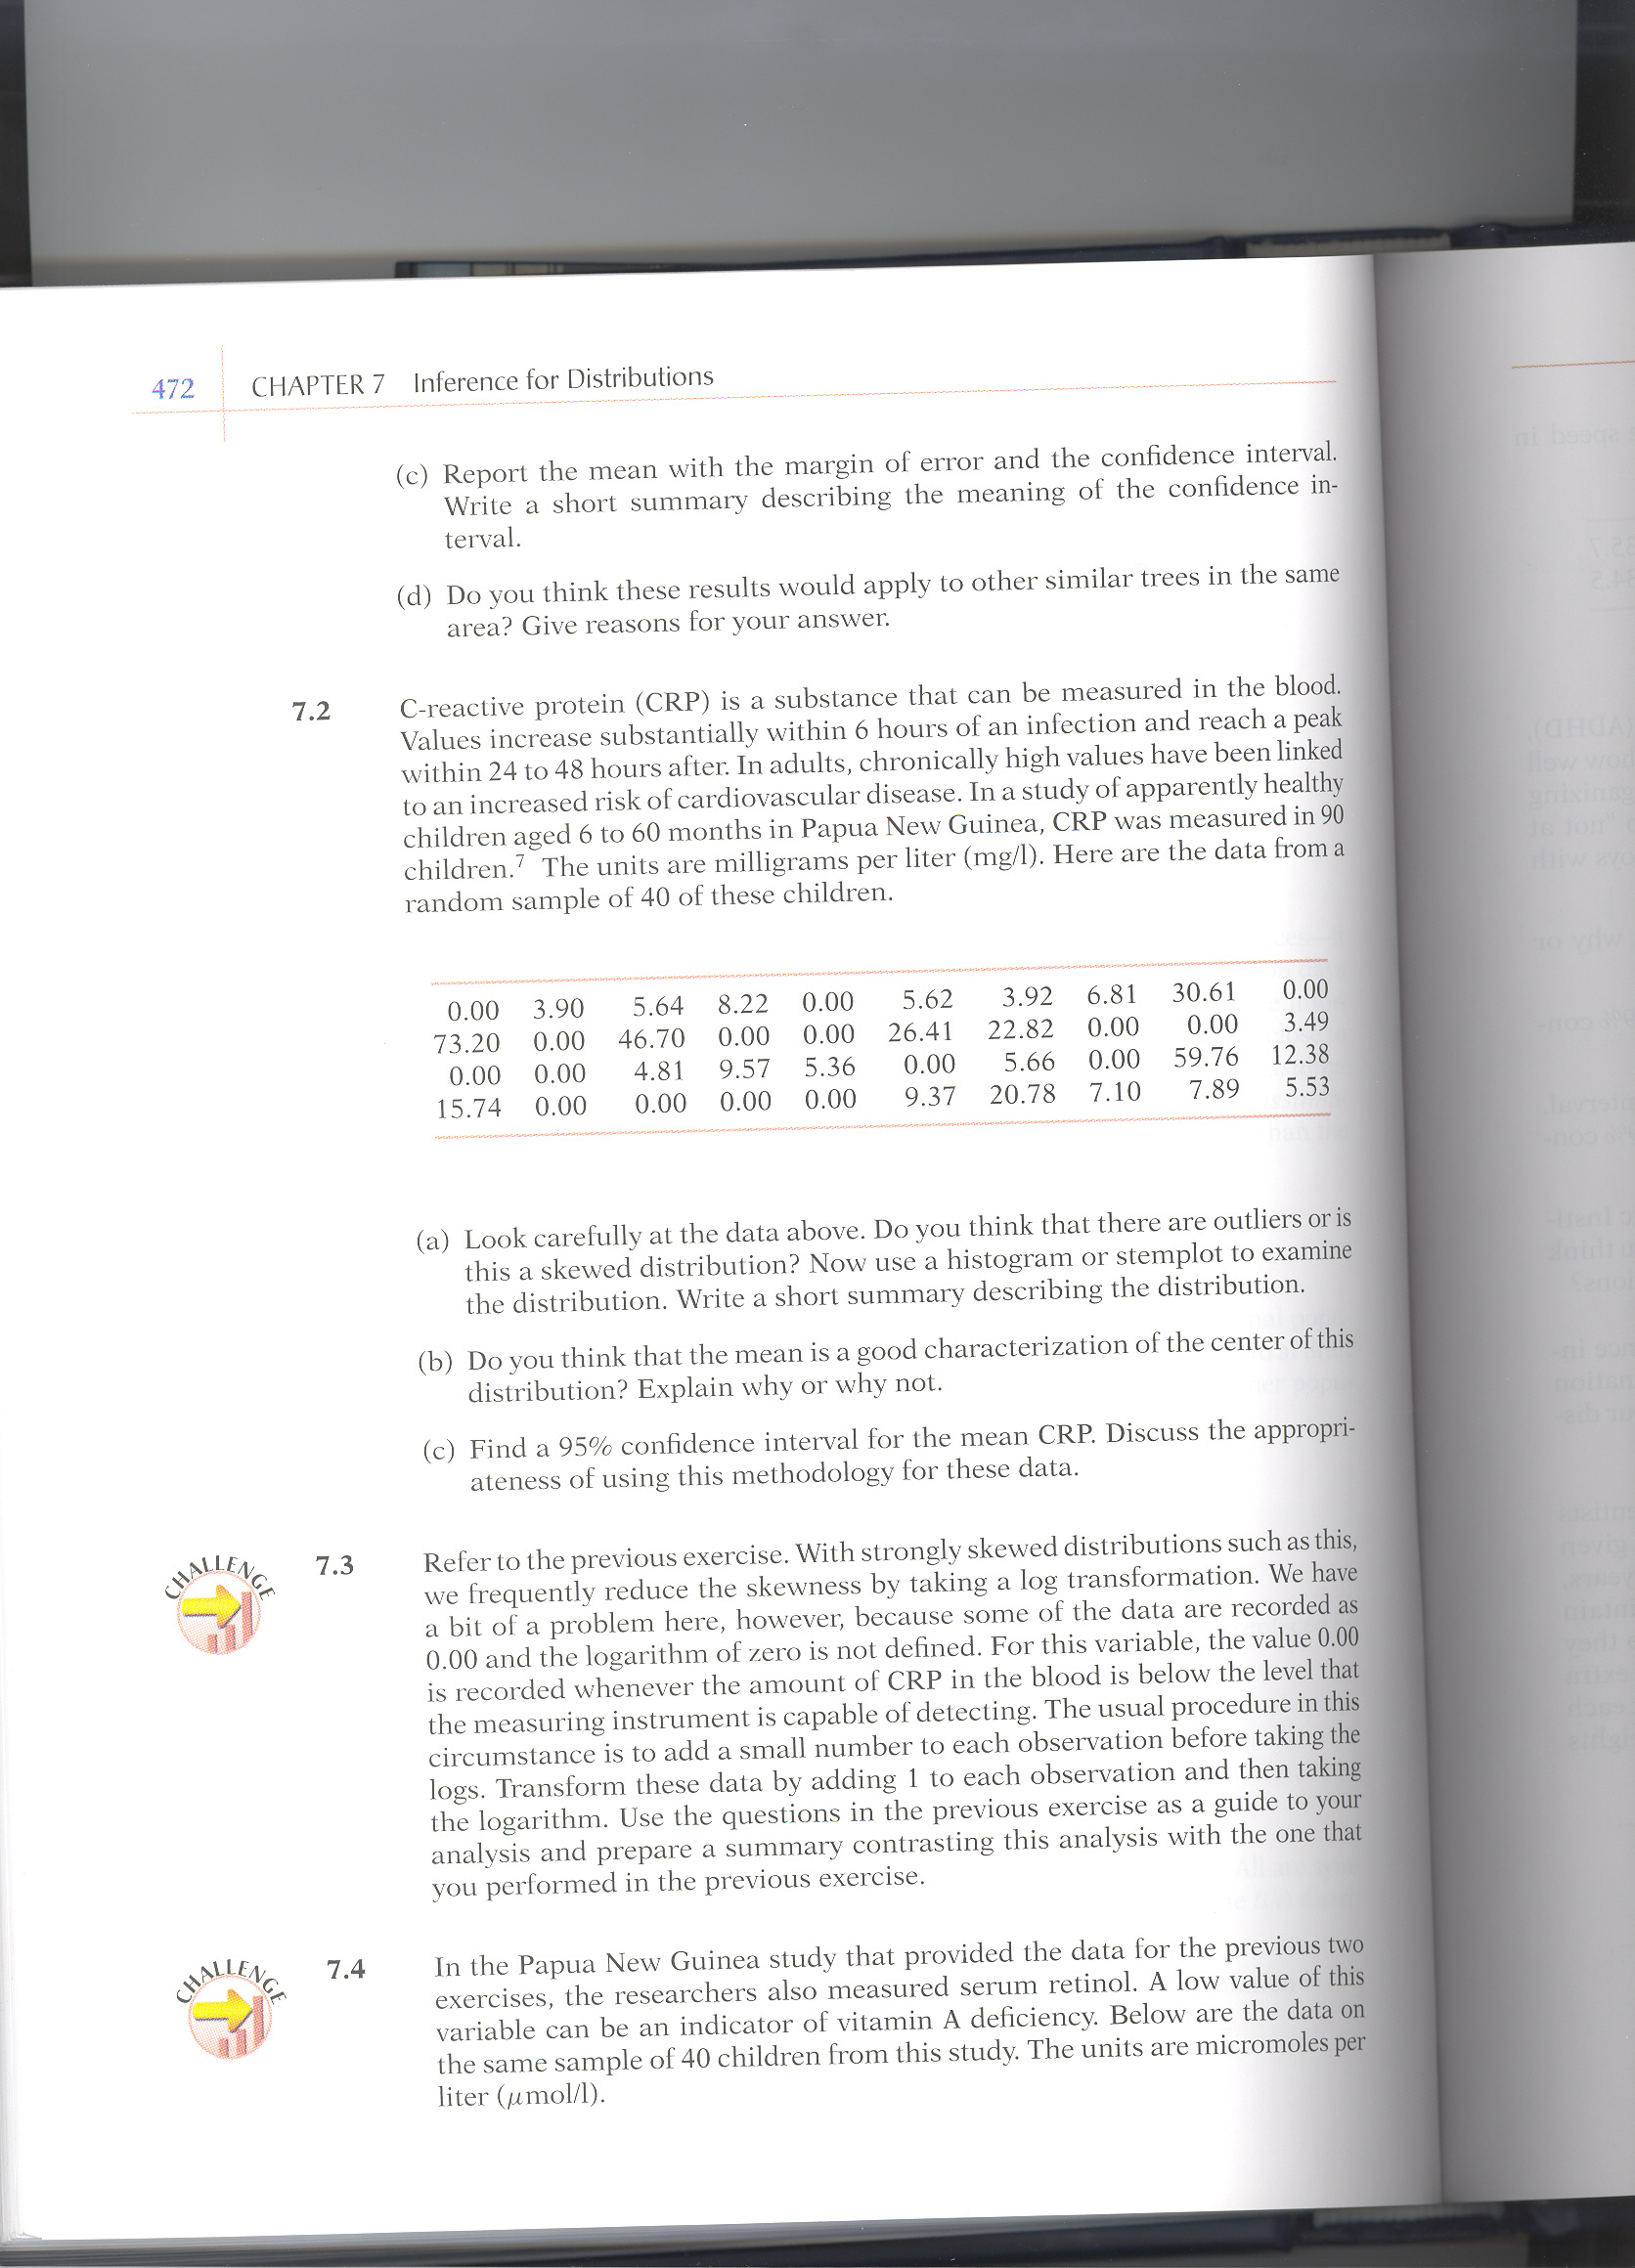
7.2. C-reactive protein (CRP) is a substance that can be measured in the blood. Values increase substantially within 6 hours of an infection and reach a peak within 24 to 48 hours after. In adults, chronically high values have been linked to an increased risk of cardiovascular disease. In a study of apparently healthy children aged 6 to 60 months in Papua New Guinea, CRP was measured in 90 children. The units are milligrams per liter (mg/l). Here are the data from a random sample of 40 of these children. (See attachment).
a. Look carefully at the data above. Do you think that there are outliers or is this a skewed distribution? Now use a histogram or stemplot to examine the distribution. Write a short summary describing the distribution.
b. Do you think that the mean is a good characterization of the center of this distribution? Explain why or why not.
c. Find a 95% confidence interval for the mean CRP. Discuss the appropriateness of using this methodology for these data.
Purchase this Solution
Solution Summary
This solution provides a boxplot of each scenario and a statistical analysis of the distribution seen. The mean of sample, margin of error and confidence interval are calculated in clear steps.
Purchase this Solution
Free BrainMass Quizzes
Know Your Statistical Concepts
Each question is a choice-summary multiple choice question that presents you with a statistical concept and then 4 numbered statements. You must decide which (if any) of the numbered statements is/are true as they relate to the statistical concept.
Measures of Central Tendency
This quiz evaluates the students understanding of the measures of central tendency seen in statistics. This quiz is specifically designed to incorporate the measures of central tendency as they relate to psychological research.
Terms and Definitions for Statistics
This quiz covers basic terms and definitions of statistics.
Measures of Central Tendency
Tests knowledge of the three main measures of central tendency, including some simple calculation questions.