Histograms, Frequency Polygons, Mean, Median, Mode, Class Mid-Point, Pie and Bar Charts
Not what you're looking for?
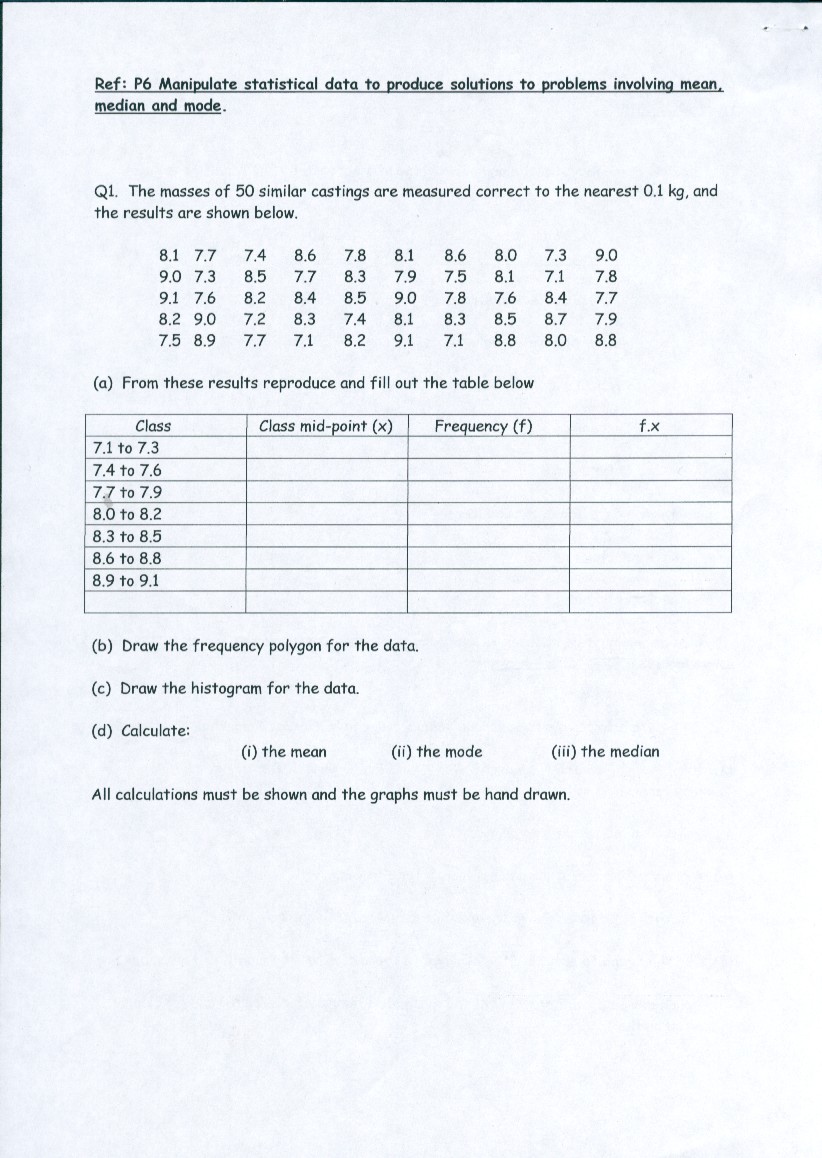
Q1. The masses of 50 similar castings are measured correct to the nearest 0.1 kg, and the results are shown below.
8.1 7.7 7.4 8.6 7.8 8.1 8.6 8.0 7.3 9.0
9.0 7.3 8.5 7.7 8.3 7.9 7.5 8.1 7.1 7.8
9.1 7.6 8.2 8.4 8.5 9.0 7.8 7.6 8.4 7.7
8.2 9.0 7.2 8.3 7.4 8.1 8.3 8,5 8.7 7.9
7.5 8.9 7.7 7.1 8.2 9.1 7.1 8.8 8.0 8.8
(a) From these results reproduce and fill out the table below
Class Class mid-point (x) Frequency(f) f.x
7.1 to 7.3
7.4 to 7.6
7.7 to 7.9
8.Oto8.2
8.3 to 8.5
8.6 to 8.8
8.9 to 9.1
(b) Draw the frequency polygon for the data.
(c) Draw the histogram for the data.
(d) Calculate:
(1) the mean (ii) the mode (iii) the median
All calculations must be shown and the graphs must be hand drawn.
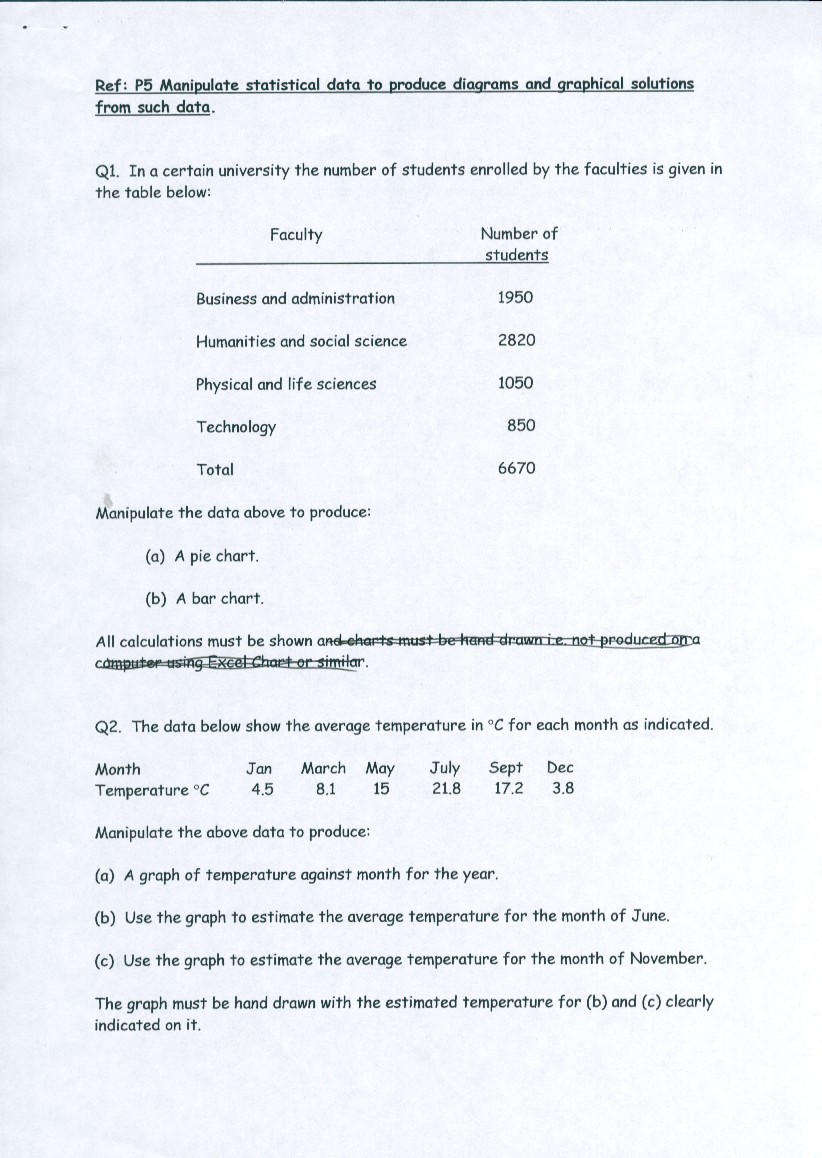
QI. In a certain university the number of students enrolled by the faculties is given
the table below:
Faculty Number of
students
Business and administration 1950
Humanities and social science 2820
Physical and life sciences 1050
Technology 850
Total 6670
Manipulate the data above to produce:
(a) A pie chart.
(b) A bar chart.
Q2. The data below show the average temperature in °C for each month as indicated.
Month Jan March May July Sept bec
Temperature °C 4.5 8.1 15 21.8 17.2 3.8
Manipulate the above data to produce:
(a) A graph of temperature against month for the year.
(b) Use the graph to estimate the average temperature for the month of June.
(c) Use the graph to estimate the average temperature for the month of November.
The graph must be hand drawn with the estimated temperature for (b) and (c) clearly indicated on it.
Purchase this Solution
Solution Summary
Histograms, Frequency Polygons, Mean, Median, Mode, Class Mid-Point, Pie and Bar Charts are investigated.
Solution Preview
Please see the attached file for the complete solution (answers are on different sheets in the same file).
Thanks for using BrainMass.
Q1: the question on measurements of 50 castings
The mid-points are easily enough to determine.
For Class 7.1 to 7.3, the midpoint is 7.2.
For Class 7.4 to 7.6, the midpoint is 7.5.
The rest you can determine. It's just the half way point between the two numbers. To calculate it, you add up the two numbers and divide by 2. For example, for the first class, 7.1 + 7.3 = 14.4. Then divide by 2 = 7.2
To determine frequency, you must count the number of measurements that fall within each class. For example, for Class 7.1 to 7.3, the frequency is 6. There are six measurements that fall within the interval, 7.1 to 7.3.
Also, for Class 7.4 to 7.6, the frequency is also 6.
The rest you can determine. Just count up the number of measurements that fall within the limits of each class.
The last column of the table, you must multiply the mid-point (x) by the frequency (f). Therefore, for the first class, you would have 7.2 x 6 = 43.2.
For the second class, the 7.4 to 7.6 class, you calculate f.x as, 7.5 x 6 = 45.
You can repeat those ...
Purchase this Solution
Free BrainMass Quizzes
Measures of Central Tendency
Tests knowledge of the three main measures of central tendency, including some simple calculation questions.
Terms and Definitions for Statistics
This quiz covers basic terms and definitions of statistics.
Know Your Statistical Concepts
Each question is a choice-summary multiple choice question that presents you with a statistical concept and then 4 numbered statements. You must decide which (if any) of the numbered statements is/are true as they relate to the statistical concept.
Measures of Central Tendency
This quiz evaluates the students understanding of the measures of central tendency seen in statistics. This quiz is specifically designed to incorporate the measures of central tendency as they relate to psychological research.