Regression Analysis of Professor Salaries
Not what you're looking for?
See the attached file.
Question 1 - 5
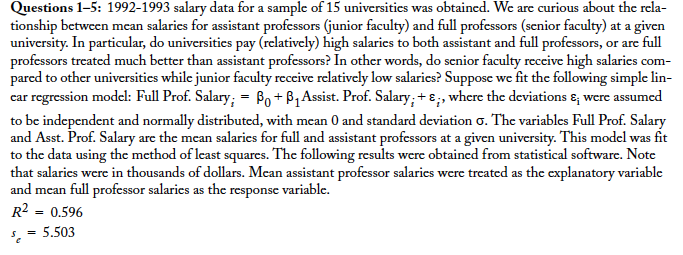
1992-1993 Salary data for a sample of 15 universities was obtained. We are curious about the relationship between mean salaries for assistant professors (junior faculty) and full professors (senior faculty) at a given university. IN particular, do universities pay (relatively) high salaries to both assistant and full professors, or are full professors treated much better than assistant professors? In other words, do senior faculty receive high salaries compared to other universities while junior faculty receive relatively low salaries? Suppose we fit the following simple linear regression model:
Full Prof. Salary = (see attached file) Asist. Prof. Salary + (see attached file). The variables full Prof. Salary and Asst. Prof. Salary are the mean salaries for full and assistant professors at a given university. This model was fit to the data using the method of least squares. The following results were obtained from statistical software. Not that salaries were in thousands of dollars. Mean assistant professors salaries were treated as the explanatory variable and mean full professor salaries as the response variable.
1. The intercept of the least-squares regression line is (approximately)
2. A 90% confidence interval for the slope 1 in the simple linear regression model is
3. Suppose the researchers test the hypotheses H0 : (see attached file).
4. The correlation between mean assistant and full professor salaries is
5. Is there strong evidence (and if so, why ) that the relationship between mean assistant and full professor salaries is adequately described by a straight line?
Questions 6 - 11
A researcher wanted to find out the effect of the number of bedrooms and bathrooms on the annual property taxes of the houses in a county. To do this he tried to create a least squares linear model to predict the property tax from the number of bedrooms and bathrooms. A random sample of 100 residential properties were collected. The annual property taxes were given in dollars. A JMP analysis of the data collected is given below.
6. What are the explanatory variables?
7. What is the equation to predict the sales tax from the number of bedrooms and
bathrooms?
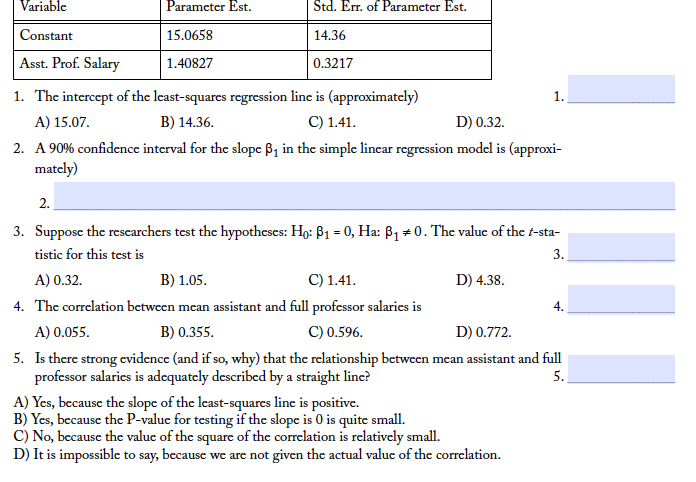
8. What would is the predicted value of the taxes for a house with three bedrooms and
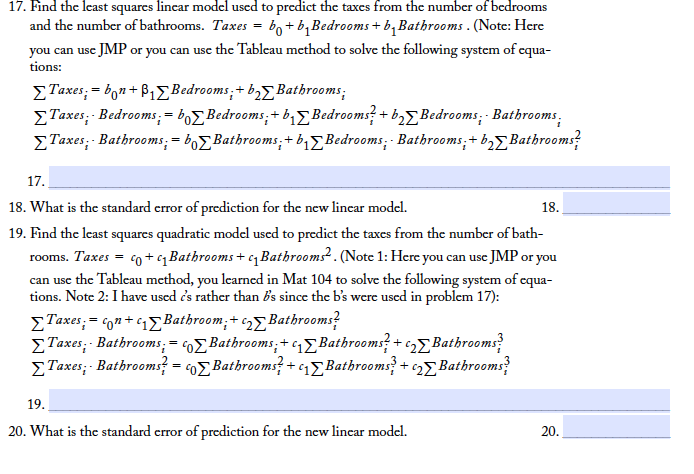
two baths?
9. The F-ratio given in the Analysis of Variance table above is used to test
H0 : (see the attached file) Here we find that the F-ratio is 23.9212 and the
Corresponding p-value is less than 0.0001. Given a 5% significance level would you
Accept or reject the null hypothesis? Explain.
10. What is the value of the test statistic?
11. What is the p-value of the test statistic ?
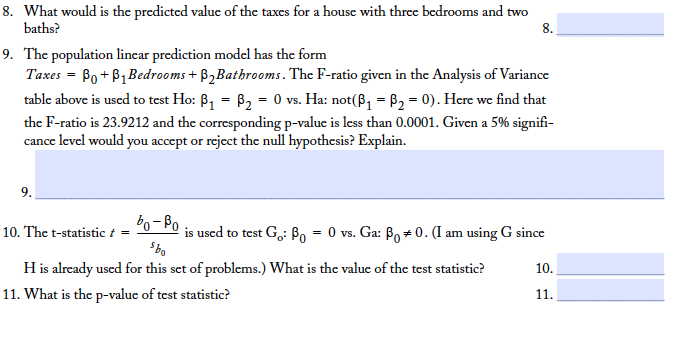
Consider the following dataset that is a subset of the dataset for the above problem.
12. Find the least squares line or regression line that could be used to predict the number
of bathrooms from the number of bedrooms.
13. Use the regression line to find the predicted number of bathrooms in a house with two
bedrooms.
14. What is the standard error in prediction?
15. Find the least squares line or regression line that could be used to predict the number
of bedrooms from the number of bathrooms.
16. What is the correlation between the number of bedrooms and the number of
bathrooms?
17. Find the least squares linear model used to predict the taxes from the number of
bedrooms and the number of bathrooms.
18. What is the standard error of prediction for the new linear model.
19. Find the least squares quadratic model used to predict the taxes from the
number of bathrooms.
20. What is the Standard Error of prediction for the new linear model?
Purchase this Solution
Solution Summary
The solution provides statistical analysis for professors salaries at 15 different universities.
Solution Preview
Please see the attached file for fully formatted explanations.
Question 1 - 5
1992-1993 Salary data for a sample of 15 universities was obtained. We are curious about the relationship between mean salaries for assistant professors (junior faculty) and full professors (senior faculty) at a given university. IN particular, do universities pay (relatively) high salaries to both assistant and full professors, or are full professors treated much better than assistant professors? In other words, do senior faculty receive high salaries compared to other universities while junior faculty receive relatively low salaries? Suppose we fit the following simple linear regression model:
Full Prof. Salary = β0 + β1 Asist. Prof. Salary + εi , where the deviations ε i were assumed to be independent and normally distributed, with mean 0 and standard deviation σ. The variables full Prof. Salary and Asst. Prof. Salary are the mean salaries for full and assistant professors at a given university. This model was fit to the data using the method of least squares. The following results were obtained from statistical software. Not that salaries were in thousands of dollars. Mean assistant professors salaries were treated as the explanatory variable and mean full professor salaries as the response variable.
R2 = 0.596 , Se = 5.503
Variable Parameter Est. Std. Err. of Parameter Est.
Constant 15.0658 14.36
Asst. Prof. Salary 1.40827 0.3217
1. The intercept of the least-squares regression line is (approximately)
[ Answer : (A) ]
(A) 15.07 (B) 14.36 (C) 1.41 (D) 0.32
Explanation:
Under the column of "Parameter Est." the value for "Constant" represents the intercept of the least-squares regression line. Here it is 15.07 (for constant under parameter est.)
2. A 90% confidence interval for the slope β1 in the simple linear regression model is
(approximately) [ Answer 0.8386 to 1.9780 ]
Explanation:
Since 15 universities data was used, the degree of freedom = 15 - 2 = 13
The Critical value of 't' for 13 degrees of freedom for 90% confidence = 1.771
90% confidence interval =
= 1.40827 ± 0.5697
= ( 0.83857 , 1.97797 ) [ Answer ]
3. Suppose the researchers test the hypotheses H0 : β1 = 0 , Ha : β1 ≠ 0. The value of the ...
Purchase this Solution
Free BrainMass Quizzes
Know Your Statistical Concepts
Each question is a choice-summary multiple choice question that presents you with a statistical concept and then 4 numbered statements. You must decide which (if any) of the numbered statements is/are true as they relate to the statistical concept.
Terms and Definitions for Statistics
This quiz covers basic terms and definitions of statistics.
Measures of Central Tendency
Tests knowledge of the three main measures of central tendency, including some simple calculation questions.
Measures of Central Tendency
This quiz evaluates the students understanding of the measures of central tendency seen in statistics. This quiz is specifically designed to incorporate the measures of central tendency as they relate to psychological research.