Econometrics problem: Hourly Earnings and Unemployment Rate
Not what you're looking for?
See attached files.
The excel document is the data needed for the question and the other 3 uploads are the references to the question in the problem:
Hourly Earnings and Unemployment Rate
Complete Problem 5.29 of Chapter 5.
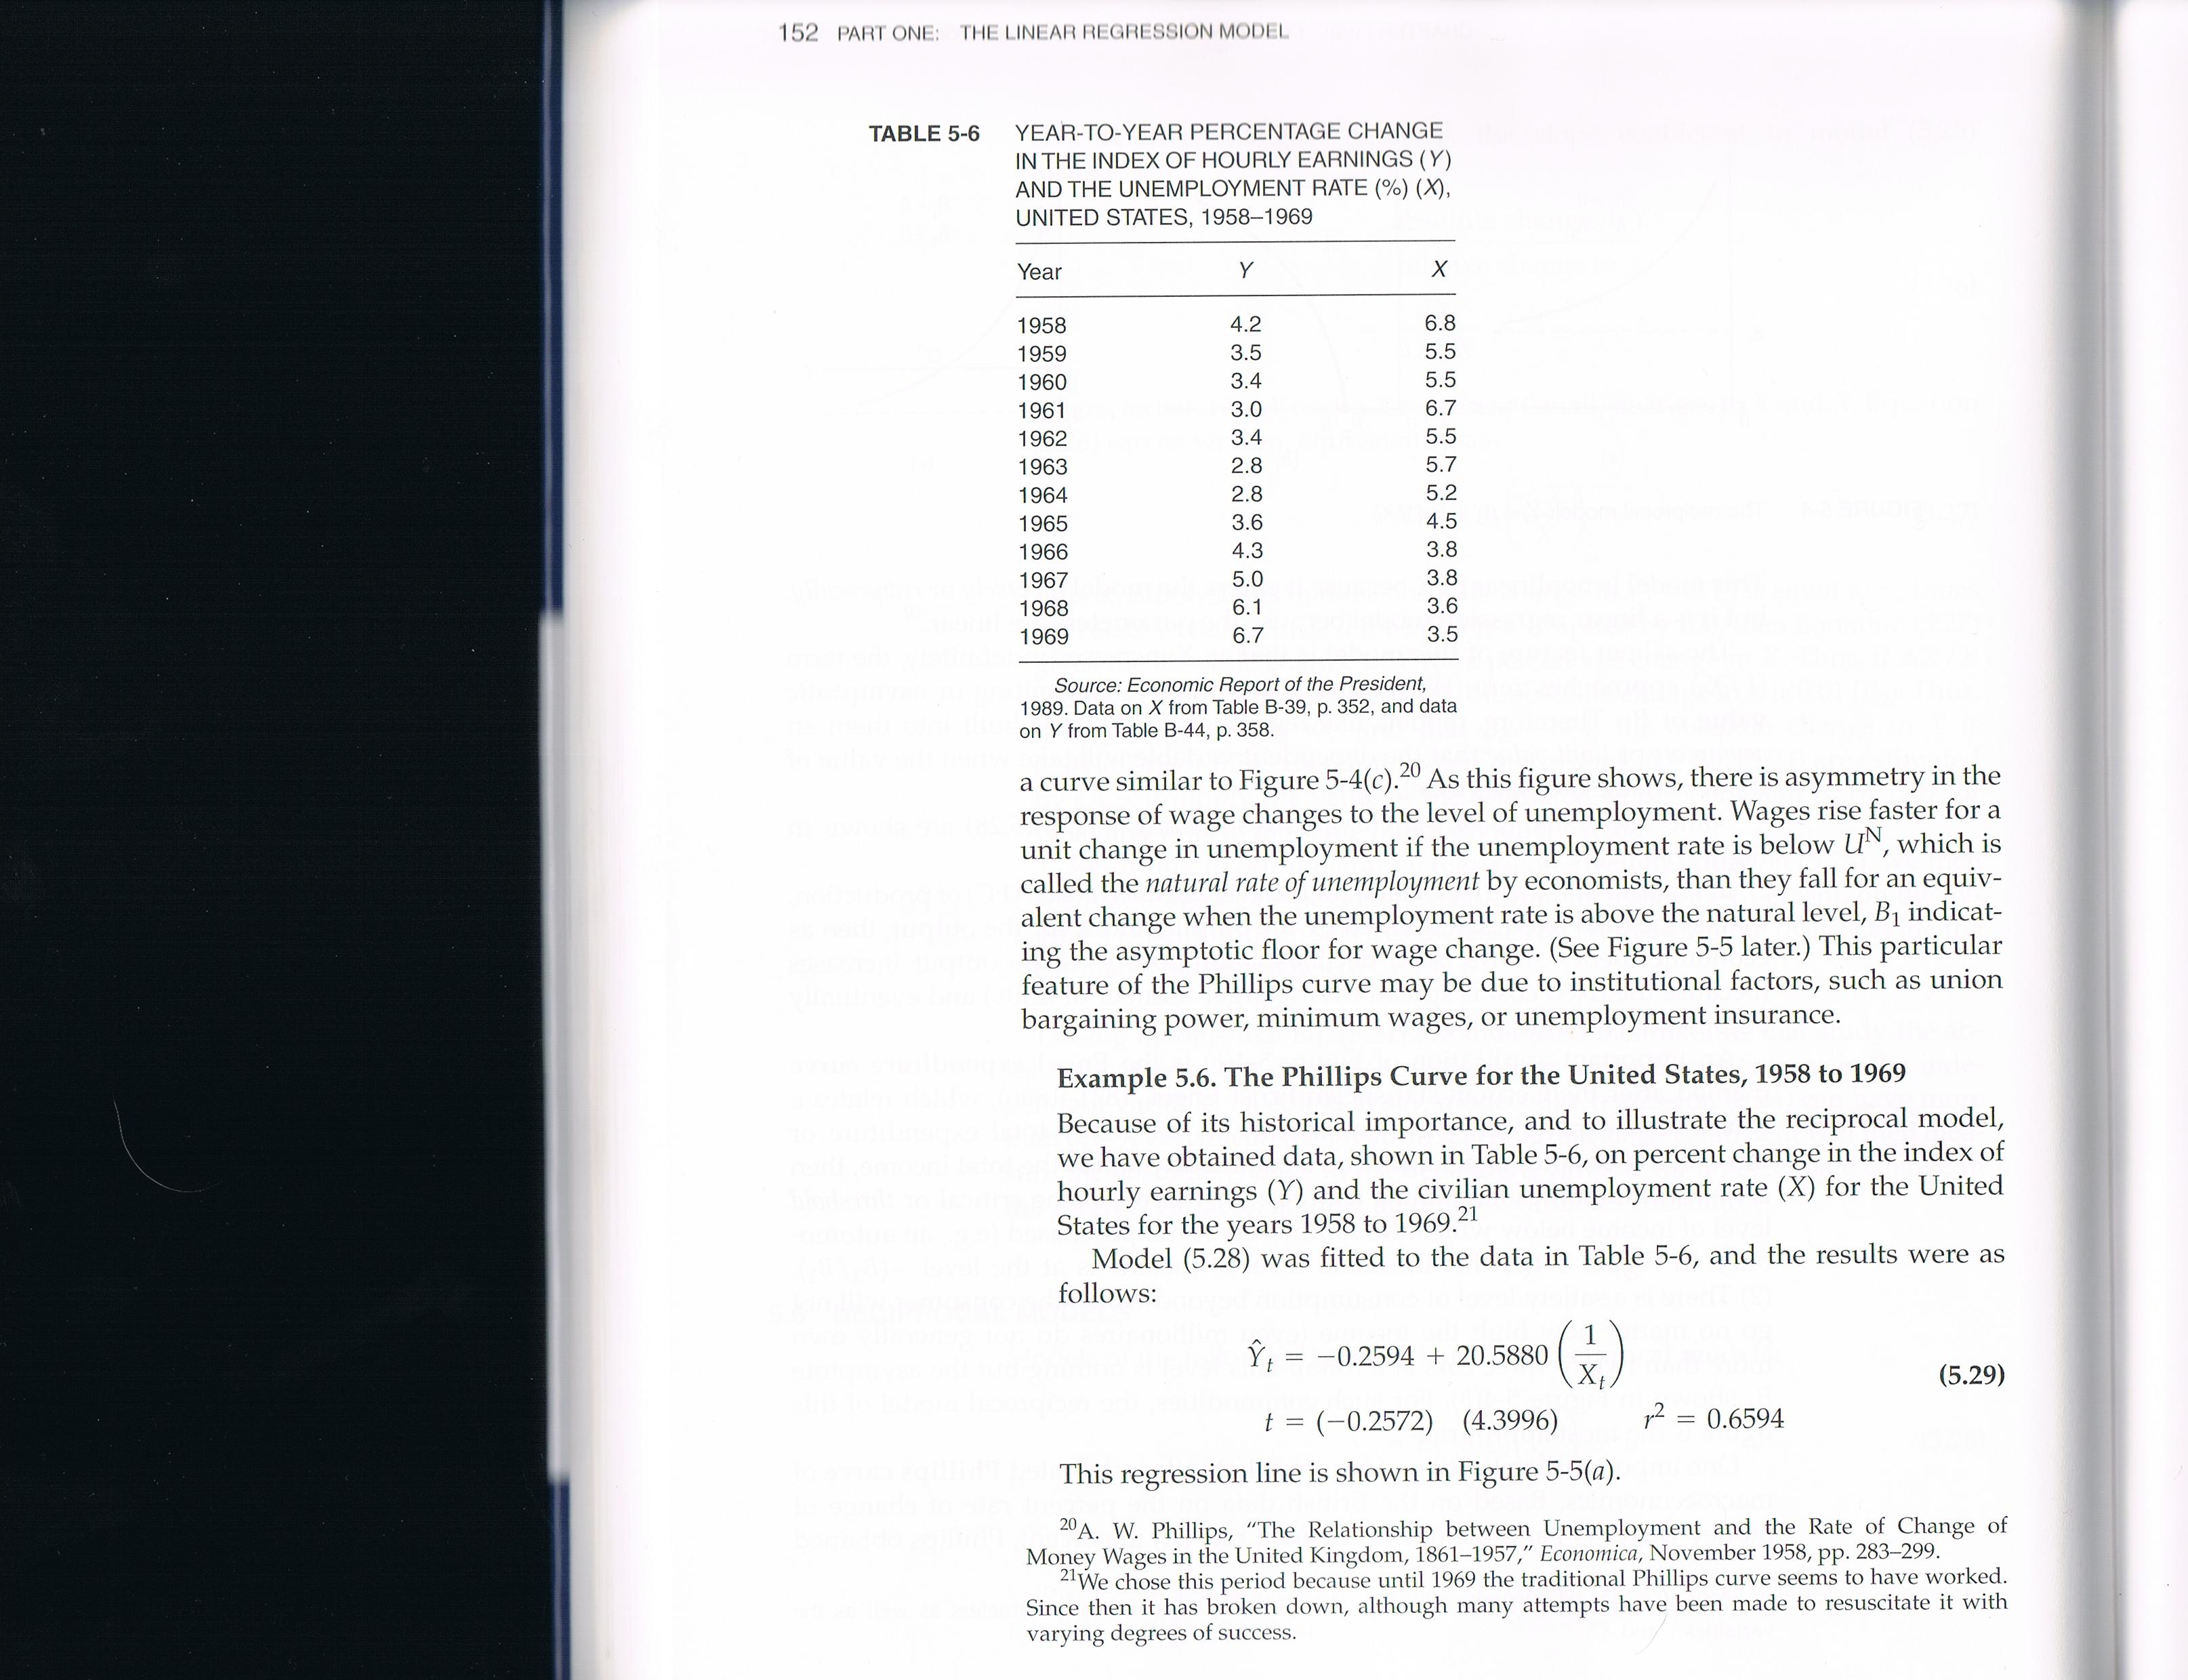
5.29. Refer to Example 5.6 in the chapter. It was shown that the percentage change in the index of hourly earnings and the unemployment rate from 1958-1969 followed the traditional Phillips curve model. An updated version of the data, from 1965-2007, can be found in Table 5-19 on the textbook's Web site.
a. Create a scattergram using the percentage change in hourly earnings as the Y variable and the unemployment rate as the X variable.
Does the graph appear linear?
b. Now create a scattergram as above, but use 1/X as the independent variable. Does this seem better than the graph in part (a)?
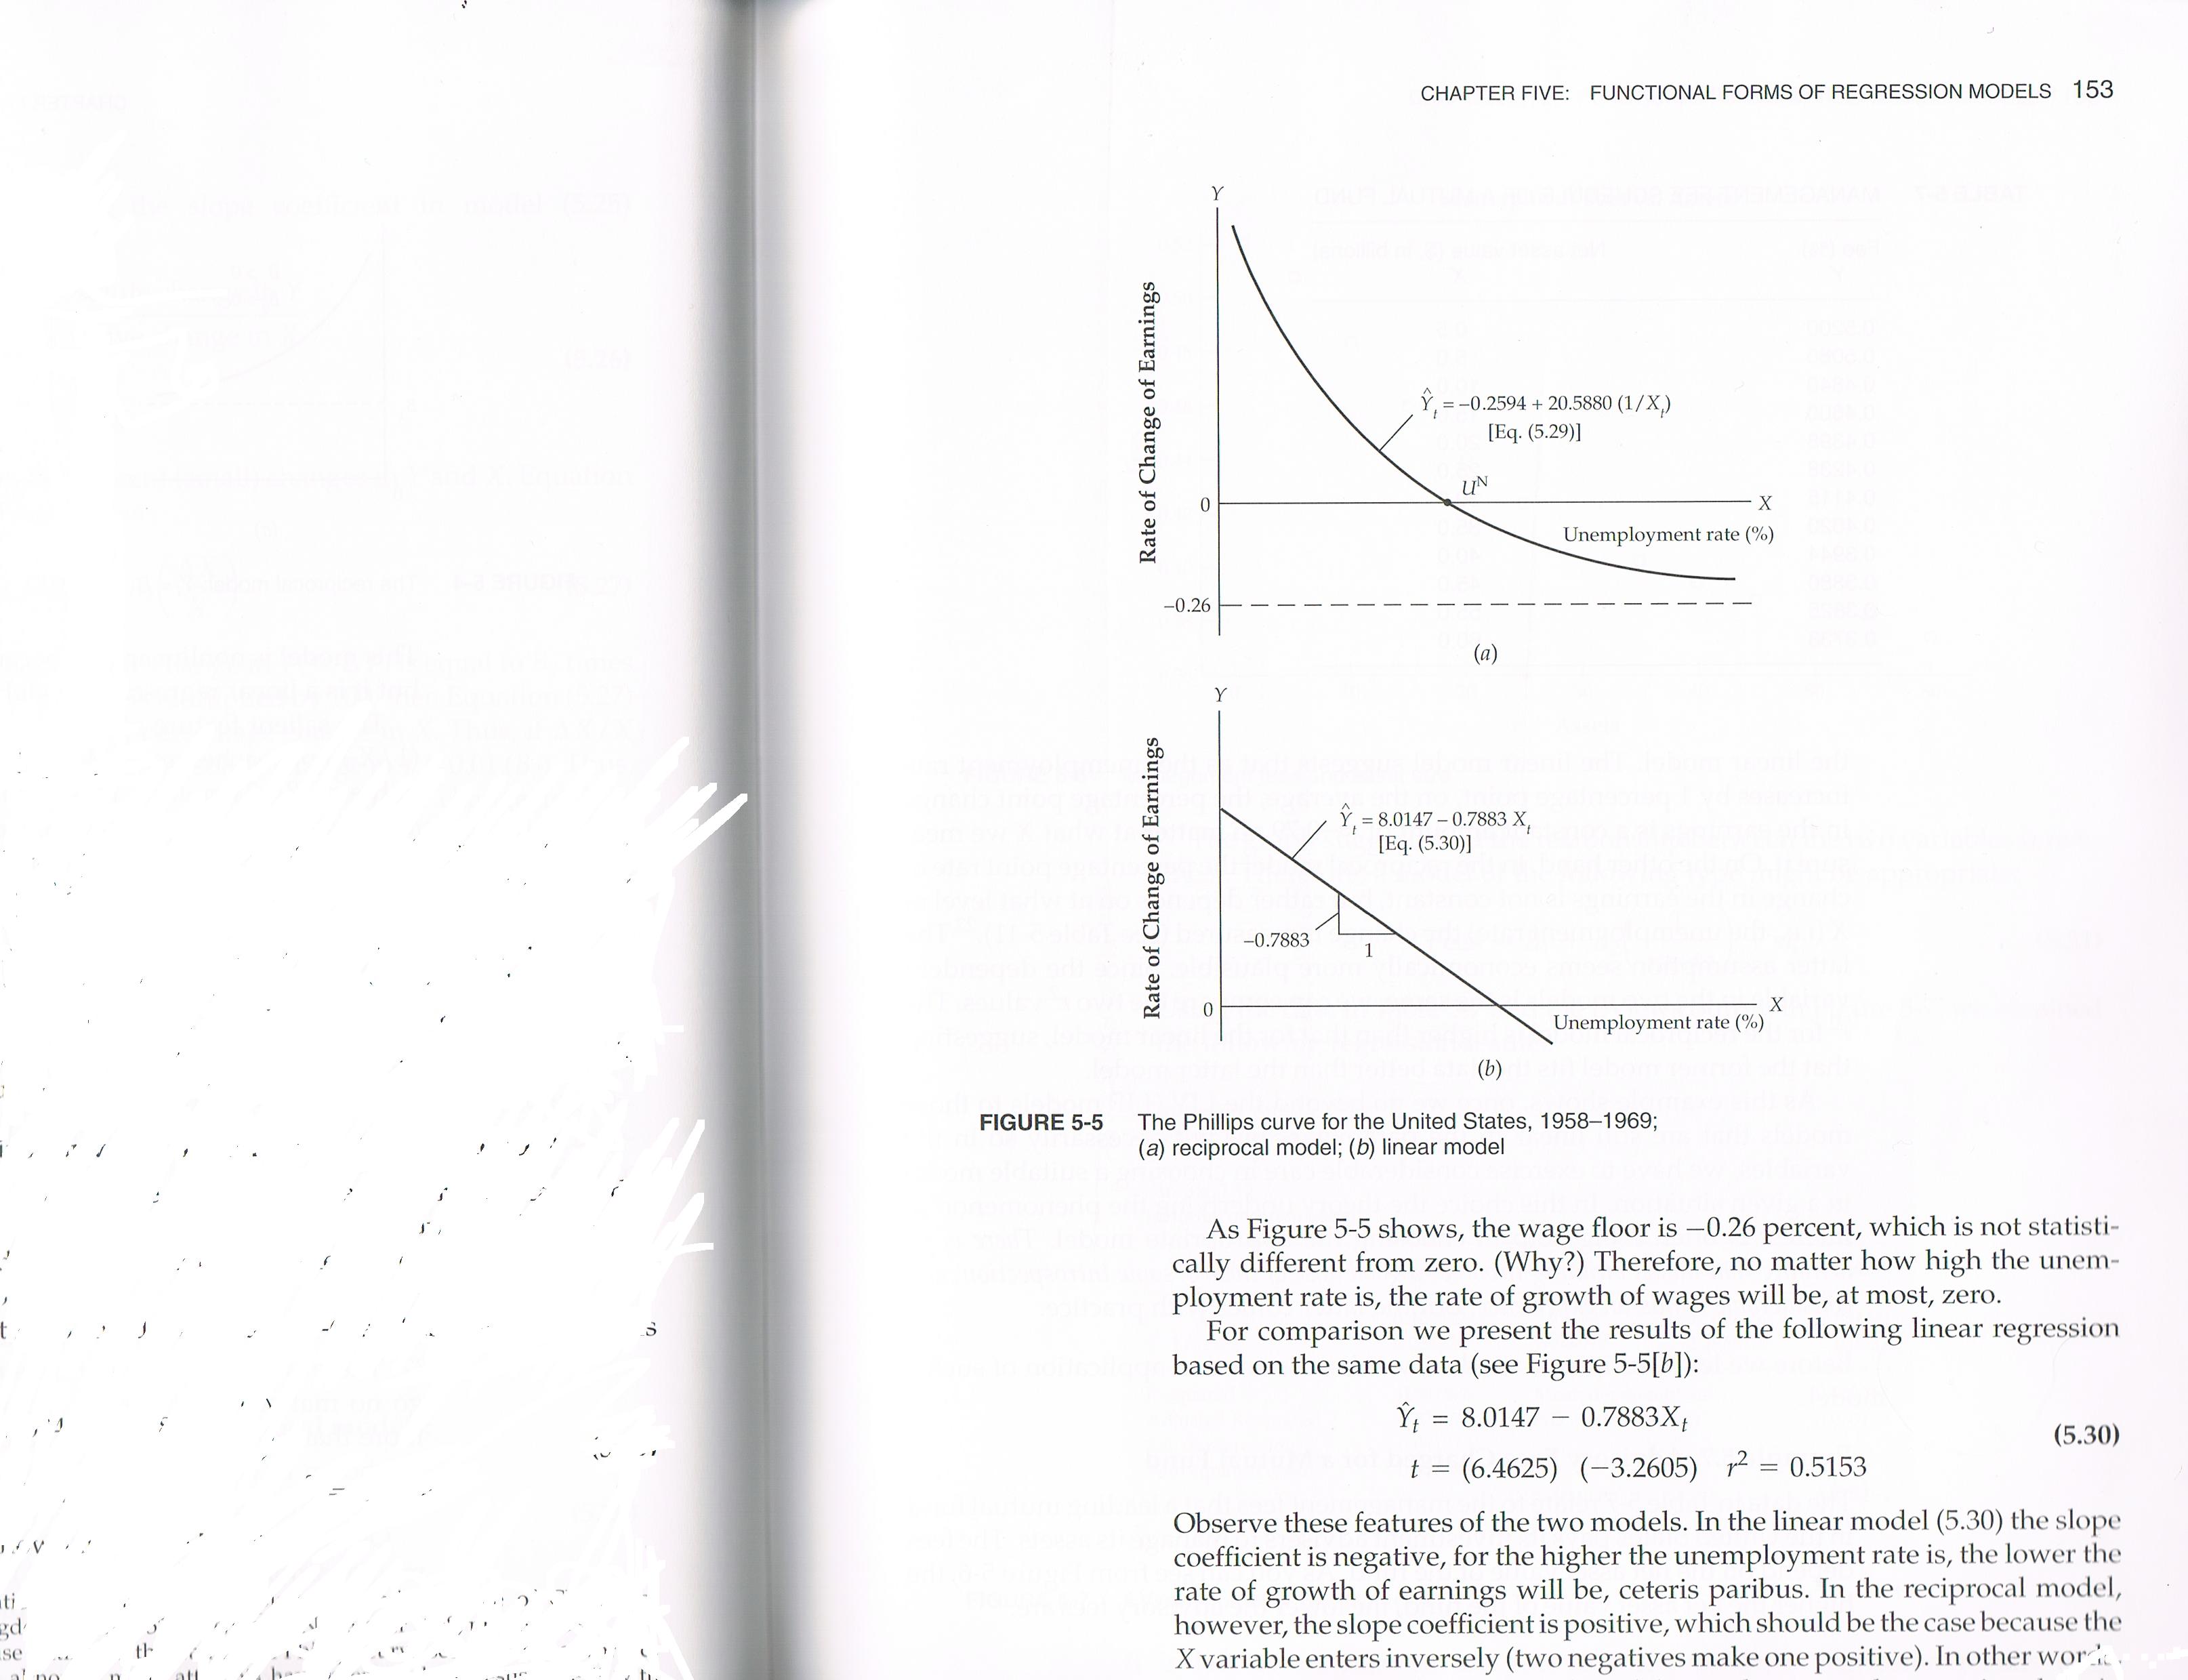
c. Fit Eq. (5.29)(which is in the pages of text I have sent you on page 152) to the new data. Does this model seem to fit well? Also create a regular linear (LIV) model as in Eq. (5.30)( which is in the pages of text I have sent you on page 153). Which model is better? Why?
Purchase this Solution
Solution Summary
A Complete, Neat and Step-by-step Solution is provided in the attached file.
Purchase this Solution
Free BrainMass Quizzes
Terms and Definitions for Statistics
This quiz covers basic terms and definitions of statistics.
Measures of Central Tendency
Tests knowledge of the three main measures of central tendency, including some simple calculation questions.
Measures of Central Tendency
This quiz evaluates the students understanding of the measures of central tendency seen in statistics. This quiz is specifically designed to incorporate the measures of central tendency as they relate to psychological research.
Know Your Statistical Concepts
Each question is a choice-summary multiple choice question that presents you with a statistical concept and then 4 numbered statements. You must decide which (if any) of the numbered statements is/are true as they relate to the statistical concept.